## Chart: Multi-Agent Hybrid Pursuit-Evasion Game: State Evolution & Control Strategies
### Overview
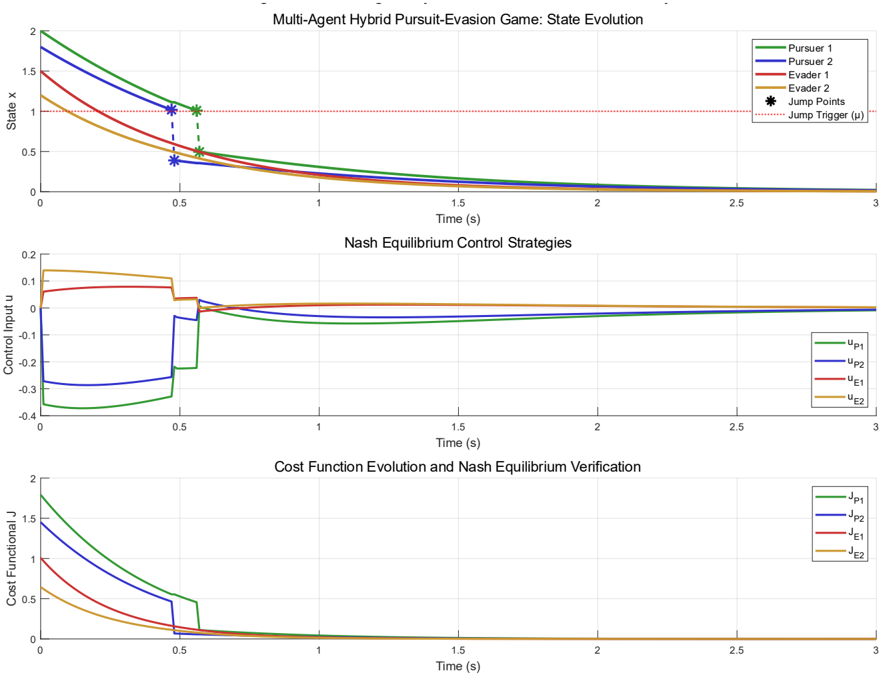
The image presents three sub-charts visualizing the state evolution, Nash equilibrium control strategies, and cost function evolution within a multi-agent pursuit-evasion game. The charts share a common time axis (0 to 3 seconds). The top chart shows the state (position 'x') of pursuers and evaders over time. The middle chart displays the control inputs applied by each agent. The bottom chart illustrates the cost functional 'J' for each agent.
### Components/Axes
* **Top Chart:**
* **X-axis:** Time (s), ranging from 0 to 3, with increments of 0.5.
* **Y-axis:** State X, ranging from 0 to 2, with increments of 0.5.
* **Data Series:**
* Pursuer 1 (Purple)
* Pursuer 2 (Green)
* Evader 1 (Orange)
* Evader 2 (Red)
* **Markers:** Black stars representing "Jump Points" and a dashed red line representing "Jump Trigger (u*)".
* **Middle Chart:**
* **X-axis:** Time (s), ranging from 0 to 3, with increments of 0.5.
* **Y-axis:** Control Input u, ranging from -0.4 to 0.2, with increments of 0.1.
* **Data Series:**
* uP1 (Blue)
* uP2 (Orange)
* uE1 (Green)
* uE2 (Red)
* **Bottom Chart:**
* **X-axis:** Time (s), ranging from 0 to 3, with increments of 0.5.
* **Y-axis:** Cost Functional J, ranging from 0 to 2, with increments of 0.5.
* **Data Series:**
* JP1 (Green)
* JP2 (Orange)
* JE1 (Red)
* JE2 (Blue)
### Detailed Analysis
* **Top Chart (State Evolution):**
* Pursuer 1 (Purple): Starts at approximately 1.8, decreases steadily to approximately 0.5 by 3 seconds.
* Pursuer 2 (Green): Starts at approximately 1.5, decreases steadily to approximately 0.5 by 3 seconds.
* Evader 1 (Orange): Starts at approximately 1.2, decreases to approximately 0.2 by 3 seconds.
* Evader 2 (Red): Starts at approximately 0.8, decreases to approximately 0.1 by 3 seconds.
* Jump Points (Black Stars): Appear around 0.4 seconds, with values approximately 1.6, 1.3, 1.1, and 0.7 for Pursuer 1, Pursuer 2, Evader 1, and Evader 2 respectively.
* Jump Trigger (u*) (Dashed Red Line): Remains relatively constant at approximately 0.8.
* **Middle Chart (Nash Equilibrium Control Strategies):**
* uP1 (Blue): Starts at approximately -0.3, increases to approximately 0.1 by 0.5 seconds, then remains relatively constant.
* uP2 (Orange): Starts at approximately -0.3, increases sharply to approximately 0.1 by 0.5 seconds, then remains relatively constant.
* uE1 (Green): Starts at approximately 0.1, decreases to approximately -0.3 by 0.5 seconds, then remains relatively constant.
* uE2 (Red): Starts at approximately 0.1, decreases to approximately -0.3 by 0.5 seconds, then remains relatively constant.
* **Bottom Chart (Cost Function Evolution):**
* JP1 (Green): Starts at approximately 1.8, decreases steadily to approximately 0.5 by 3 seconds.
* JP2 (Orange): Starts at approximately 1.5, decreases steadily to approximately 0.5 by 3 seconds.
* JE1 (Red): Starts at approximately 1.2, decreases to approximately 0.2 by 3 seconds.
* JE2 (Blue): Starts at approximately 0.8, decreases to approximately 0.1 by 3 seconds.
### Key Observations
* All state values (top chart) decrease over time, indicating the pursuers are approaching the evaders.
* The control inputs (middle chart) show a clear divergence between pursuers and evaders, with pursuers applying positive control inputs and evaders applying negative control inputs after the initial phase.
* The cost functions (bottom chart) decrease over time, suggesting that the agents are optimizing their strategies to minimize their cost.
* The Jump Points appear to coincide with a change in the control strategies.
### Interpretation
The charts demonstrate the dynamics of a multi-agent pursuit-evasion game. The state evolution chart shows the pursuers closing in on the evaders. The control strategies chart reveals how each agent adjusts its actions to optimize its performance. The cost function chart confirms that the agents are indeed minimizing their cost over time. The Jump Points and Jump Trigger suggest a discrete event or a change in strategy triggered by a specific condition. The consistent decrease in cost functions indicates the agents are converging towards a Nash equilibrium, where no agent can improve its cost by unilaterally changing its strategy. The fact that the pursuers and evaders have different control strategies is expected, as they have opposing goals. The overall system appears to be stable, with the agents converging towards a predictable outcome. The data suggests a successful implementation of Nash equilibrium seeking control strategies in a pursuit-evasion scenario.