TECHNICAL ASSET FINGERPRINT
c9b7857801771254c60b31e2
Click to view fullscreen
Press ESC or click to close
FOUND IN PAPERS
EXPERT: gemini-2.0-flash VERSION 1
RUNTIME: nugit/gemini/gemini-2.0-flash
INTEL_VERIFIED
## Chart: Answer Accuracy vs. Layer for Different Language Models
### Overview
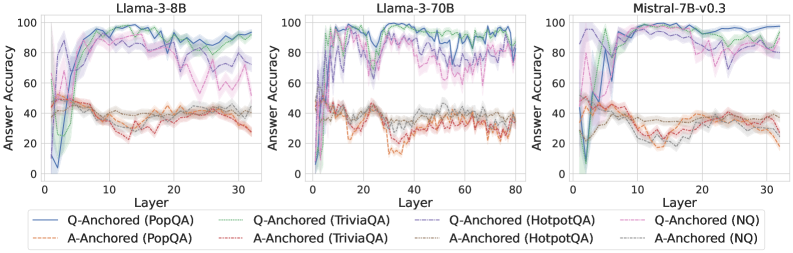
The image presents three line charts comparing the answer accuracy of different language models (Llama-3-8B, Llama-3-70B, and Mistral-7B-v0.3) across various layers. Each chart plots answer accuracy against the layer number for both question-anchored (Q-Anchored) and answer-anchored (A-Anchored) approaches on four different datasets: PopQA, TriviaQA, HotpotQA, and NQ. The charts aim to illustrate how accuracy changes with layer depth for each model and dataset combination.
### Components/Axes
* **Titles:**
* Left Chart: Llama-3-8B
* Middle Chart: Llama-3-70B
* Right Chart: Mistral-7B-v0.3
* **Y-Axis (Answer Accuracy):**
* Scale: 0 to 100
* Markers: 0, 20, 40, 60, 80, 100
* Label: Answer Accuracy
* **X-Axis (Layer):**
* Left Chart: 0 to 30
* Markers: 0, 10, 20, 30
* Middle Chart: 0 to 80
* Markers: 0, 20, 40, 60, 80
* Right Chart: 0 to 30
* Markers: 0, 10, 20, 30
* Label: Layer
* **Legend (Located at the bottom):**
* Q-Anchored (PopQA): Solid Blue Line
* A-Anchored (PopQA): Dashed Brown Line
* Q-Anchored (TriviaQA): Dotted Green Line
* A-Anchored (TriviaQA): Dashed Pink Line
* Q-Anchored (HotpotQA): Solid Purple Line
* A-Anchored (HotpotQA): Dashed Gray Line
* Q-Anchored (NQ): Dotted Red Line
* A-Anchored (NQ): Dashed Orange Line
### Detailed Analysis
#### Llama-3-8B (Left Chart)
* **Q-Anchored (PopQA) - Solid Blue:** Starts at approximately 0 accuracy, rapidly increases to around 90-100 by layer 10, and then fluctuates between 80 and 100 for the remaining layers.
* **A-Anchored (PopQA) - Dashed Brown:** Starts around 40-50 accuracy and remains relatively stable between 30 and 50 across all layers.
* **Q-Anchored (TriviaQA) - Dotted Green:** Starts at approximately 0 accuracy, rapidly increases to around 90-100 by layer 10, and then fluctuates between 80 and 100 for the remaining layers.
* **A-Anchored (TriviaQA) - Dashed Pink:** Starts around 40-50 accuracy, increases to around 80 by layer 10, and then fluctuates between 60 and 80 for the remaining layers.
* **Q-Anchored (HotpotQA) - Solid Purple:** Starts at approximately 0 accuracy, rapidly increases to around 90-100 by layer 10, and then fluctuates between 80 and 100 for the remaining layers.
* **A-Anchored (HotpotQA) - Dashed Gray:** Starts around 40-50 accuracy and remains relatively stable between 30 and 50 across all layers.
* **Q-Anchored (NQ) - Dotted Red:** Starts around 20 accuracy, increases to around 40 by layer 10, and then fluctuates between 20 and 40 for the remaining layers.
* **A-Anchored (NQ) - Dashed Orange:** Starts around 20 accuracy, increases to around 40 by layer 10, and then fluctuates between 20 and 40 for the remaining layers.
#### Llama-3-70B (Middle Chart)
* **Q-Anchored (PopQA) - Solid Blue:** Starts at approximately 40 accuracy, rapidly increases to around 90-100 by layer 20, and then fluctuates between 80 and 100 for the remaining layers.
* **A-Anchored (PopQA) - Dashed Brown:** Starts around 40-50 accuracy and remains relatively stable between 30 and 50 across all layers.
* **Q-Anchored (TriviaQA) - Dotted Green:** Starts at approximately 40 accuracy, rapidly increases to around 90-100 by layer 20, and then fluctuates between 80 and 100 for the remaining layers.
* **A-Anchored (TriviaQA) - Dashed Pink:** Starts around 40-50 accuracy, increases to around 80 by layer 20, and then fluctuates between 60 and 80 for the remaining layers.
* **Q-Anchored (HotpotQA) - Solid Purple:** Starts at approximately 40 accuracy, rapidly increases to around 90-100 by layer 20, and then fluctuates between 80 and 100 for the remaining layers.
* **A-Anchored (HotpotQA) - Dashed Gray:** Starts around 40-50 accuracy and remains relatively stable between 30 and 50 across all layers.
* **Q-Anchored (NQ) - Dotted Red:** Starts around 20 accuracy, increases to around 40 by layer 20, and then fluctuates between 20 and 40 for the remaining layers.
* **A-Anchored (NQ) - Dashed Orange:** Starts around 20 accuracy, increases to around 40 by layer 20, and then fluctuates between 20 and 40 for the remaining layers.
#### Mistral-7B-v0.3 (Right Chart)
* **Q-Anchored (PopQA) - Solid Blue:** Starts at approximately 0 accuracy, rapidly increases to around 90-100 by layer 10, and then fluctuates between 80 and 100 for the remaining layers.
* **A-Anchored (PopQA) - Dashed Brown:** Starts around 40-50 accuracy and remains relatively stable between 30 and 50 across all layers.
* **Q-Anchored (TriviaQA) - Dotted Green:** Starts at approximately 0 accuracy, rapidly increases to around 90-100 by layer 10, and then fluctuates between 80 and 100 for the remaining layers.
* **A-Anchored (TriviaQA) - Dashed Pink:** Starts around 40-50 accuracy, increases to around 80 by layer 10, and then fluctuates between 60 and 80 for the remaining layers.
* **Q-Anchored (HotpotQA) - Solid Purple:** Starts at approximately 0 accuracy, rapidly increases to around 90-100 by layer 10, and then fluctuates between 80 and 100 for the remaining layers.
* **A-Anchored (HotpotQA) - Dashed Gray:** Starts around 40-50 accuracy and remains relatively stable between 30 and 50 across all layers.
* **Q-Anchored (NQ) - Dotted Red:** Starts around 20 accuracy, increases to around 40 by layer 10, and then fluctuates between 20 and 40 for the remaining layers.
* **A-Anchored (NQ) - Dashed Orange:** Starts around 20 accuracy, increases to around 40 by layer 10, and then fluctuates between 20 and 40 for the remaining layers.
### Key Observations
* **Q-Anchored vs. A-Anchored:** Q-Anchored approaches (PopQA, TriviaQA, HotpotQA) generally achieve higher accuracy than A-Anchored approaches across all models.
* **Dataset Performance:** PopQA, TriviaQA, and HotpotQA datasets show similar performance trends, with accuracy increasing rapidly in the initial layers for Q-Anchored approaches. NQ dataset consistently shows lower accuracy for both Q-Anchored and A-Anchored approaches.
* **Model Comparison:** All three models exhibit similar trends, but Llama-3-70B seems to require more layers to reach peak accuracy compared to Llama-3-8B and Mistral-7B-v0.3.
* **Accuracy Saturation:** For Q-Anchored approaches on PopQA, TriviaQA, and HotpotQA, accuracy tends to plateau or fluctuate after reaching a certain layer, suggesting diminishing returns with increasing depth.
### Interpretation
The data suggests that question-anchoring is a more effective strategy for achieving high answer accuracy in these language models, particularly for the PopQA, TriviaQA, and HotpotQA datasets. The lower performance of the NQ dataset may indicate that it presents a more challenging question-answering task. The observation that Llama-3-70B requires more layers to reach peak accuracy could be related to its larger size and complexity, potentially needing more processing steps to extract relevant information. The saturation effect observed in the Q-Anchored approaches implies that there is a limit to how much accuracy can be improved by simply adding more layers, suggesting that other factors, such as the quality of training data or the model architecture, may play a more significant role beyond a certain depth.
DECODING INTELLIGENCE...