\n
## Scatter Plot: Confidence vs. Target Length (Electrical Engineering)
### Overview
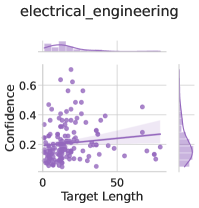
The image presents a scatter plot visualizing the relationship between "Target Length" and "Confidence," likely within the context of electrical engineering. A regression line with a confidence interval is overlaid on the scatter points, and marginal histograms are displayed above and to the right of the main plot.
### Components/Axes
* **Title:** "electrical\_engineering" (top-center)
* **X-axis:** "Target Length" (bottom-center), ranging from approximately 0 to 60.
* **Y-axis:** "Confidence" (left-center), ranging from approximately 0.1 to 0.6.
* **Scatter Points:** Numerous purple dots representing individual data points.
* **Regression Line:** A dark purple line representing the trend of the data. The line slopes downward slightly.
* **Confidence Interval:** A light purple shaded area around the regression line, indicating the uncertainty in the line's estimate.
* **Marginal Histograms:**
* Top: Histogram of "Target Length" distribution.
* Right: Histogram of "Confidence" distribution.
### Detailed Analysis
The scatter plot shows a generally negative correlation between "Target Length" and "Confidence." As "Target Length" increases, "Confidence" tends to decrease, although the relationship is weak and scattered.
* **Scatter Point Distribution:**
* The majority of points cluster between "Target Length" values of 0 and 30, with "Confidence" values between 0.15 and 0.5.
* There are fewer points with "Target Length" values greater than 40.
* The points are widely dispersed, indicating a high degree of variability.
* **Regression Line:**
* The regression line has a negative slope, confirming the general downward trend.
* The line starts at approximately "Confidence" = 0.3 when "Target Length" = 0.
* At "Target Length" = 60, the line reaches approximately "Confidence" = 0.15.
* **Confidence Interval:**
* The confidence interval is relatively wide, indicating substantial uncertainty in the regression line's estimate.
* **Marginal Histograms:**
* The top histogram shows that "Target Length" is not normally distributed, with a peak around 0 and a long tail extending to the right.
* The right histogram shows that "Confidence" is also not normally distributed, with a peak around 0.2 and a tail extending to higher values.
### Key Observations
* The relationship between "Target Length" and "Confidence" is weak and noisy.
* The confidence interval is wide, suggesting that the regression line is not a precise predictor of "Confidence."
* The marginal histograms reveal that both "Target Length" and "Confidence" are skewed distributions.
* There is a concentration of data points at low "Target Length" values.
### Interpretation
The data suggests that, in this electrical engineering context, there is a slight tendency for "Confidence" to decrease as "Target Length" increases. However, this relationship is not strong, and other factors likely play a significant role in determining "Confidence." The wide confidence interval indicates that the observed trend may not be statistically significant or generalizable. The skewed distributions of both variables suggest that the data may not meet the assumptions of standard statistical models.
The "electrical\_engineering" title suggests this data is related to a specific problem or application within that field. The "Target Length" could refer to the length of a circuit, a signal, or some other relevant parameter. The "Confidence" could represent the confidence level in a prediction, a measurement, or a decision. Further context would be needed to fully understand the meaning of these variables and the implications of the observed relationship.