\n
## Heatmaps: Mean and Standard Deviation of Conductance
### Overview
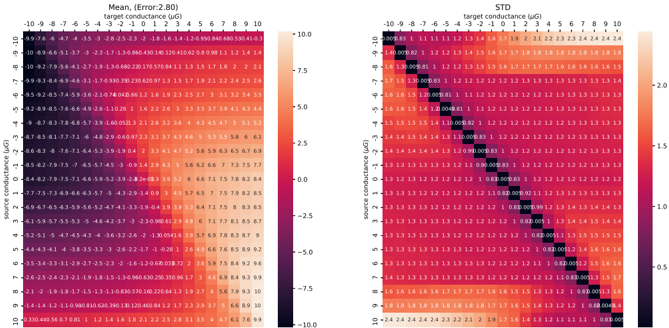
The image presents two heatmaps side-by-side. The left heatmap displays the mean values, while the right heatmap displays the standard deviation. Both heatmaps represent a two-dimensional relationship between "source conductance" and "target conductance", both measured in µG (micrograms). The color scale indicates the magnitude of the values, with darker colors representing lower values and lighter/redder colors representing higher values.
### Components/Axes
Both heatmaps share the same structure:
* **X-axis:** Target Conductance (µG), ranging from -10 to 10, with increments of 1.
* **Y-axis:** Source Conductance (µG), ranging from -10 to 10, with increments of 1.
* **Color Scale (Left):** Represents the Mean value. Ranges from approximately -10 to 10.
* **Color Scale (Right):** Represents the Standard Deviation. Ranges from approximately 0 to 20.
* **Title (Left):** "Mean, (Error:2.80)"
* **Title (Right):** "STD"
### Detailed Analysis or Content Details
**Left Heatmap (Mean)**
The heatmap shows a clear diagonal pattern. Values are generally negative when both source and target conductance are negative, and positive when both are positive. The values increase in magnitude as you move away from the origin (0,0) along the diagonal.
Here's a sampling of values (approximate, read from the heatmap):
* (-10, -10): -9.74
* (-10, 0): -2.2
* (-10, 10): 1.41
* (0, -10): -2.2
* (0, 0): 0.0
* (0, 10): 1.41
* (10, -10): 1.41
* (10, 0): 2.2
* (10, 10): 9.74
* (-5, -5): -4.7
* (5, 5): 4.7
* (-2, 2): 0.2
* (2, -2): -0.2
**Right Heatmap (Standard Deviation)**
The standard deviation heatmap shows a strong diagonal pattern with high values. The highest standard deviation values are concentrated along the diagonal where source and target conductance are similar. The standard deviation is generally lower when the source and target conductance have opposite signs.
Here's a sampling of values (approximate, read from the heatmap):
* (-10, -10): 19.5
* (-10, 0): 11.5
* (-10, 10): 5.5
* (0, -10): 11.5
* (0, 0): 1.5
* (0, 10): 5.5
* (10, -10): 5.5
* (10, 0): 11.5
* (10, 10): 19.5
* (-5, -5): 14.5
* (5, 5): 14.5
* (-2, 2): 3.5
* (2, -2): 3.5
### Key Observations
* **Mean:** The mean values exhibit a symmetrical pattern around the origin. The magnitude of the mean increases as the absolute values of both source and target conductance increase.
* **Standard Deviation:** The standard deviation is highest when source and target conductance are similar in magnitude and sign. This suggests that the relationship between source and target conductance is most consistent when they are both positive or both negative and have similar values. The standard deviation is lowest near the origin and when the source and target conductance have opposite signs.
* **Correlation:** The two heatmaps are related. The high standard deviation along the diagonal in the right heatmap corresponds to regions where the mean values are also relatively high in the left heatmap.
### Interpretation
The data suggests a strong correlation between source and target conductance. The mean heatmap indicates that the relationship is approximately linear, with a positive slope. The standard deviation heatmap reveals that the consistency of this relationship is highest when both conductances are similar in magnitude and sign.
The high standard deviation along the diagonal suggests that the system is most predictable when the source and target conductances are aligned. The lower standard deviation when the conductances have opposite signs indicates that the relationship becomes more variable and less predictable in those scenarios.
The "Error: 2.80" in the title of the mean heatmap likely refers to the estimated error associated with the mean values. This suggests that the values presented are based on some form of averaging or estimation, and there is an inherent uncertainty of approximately 2.80 units.
The data could represent a physical system where conductance is transferred or coupled between two components. The observed patterns could be due to factors such as resistance, capacitance, or other physical properties of the system. Further analysis and context would be needed to fully understand the underlying mechanisms.