\n
## Bar Chart: Energy Comparison (%) by Threshold and PRAC
### Overview
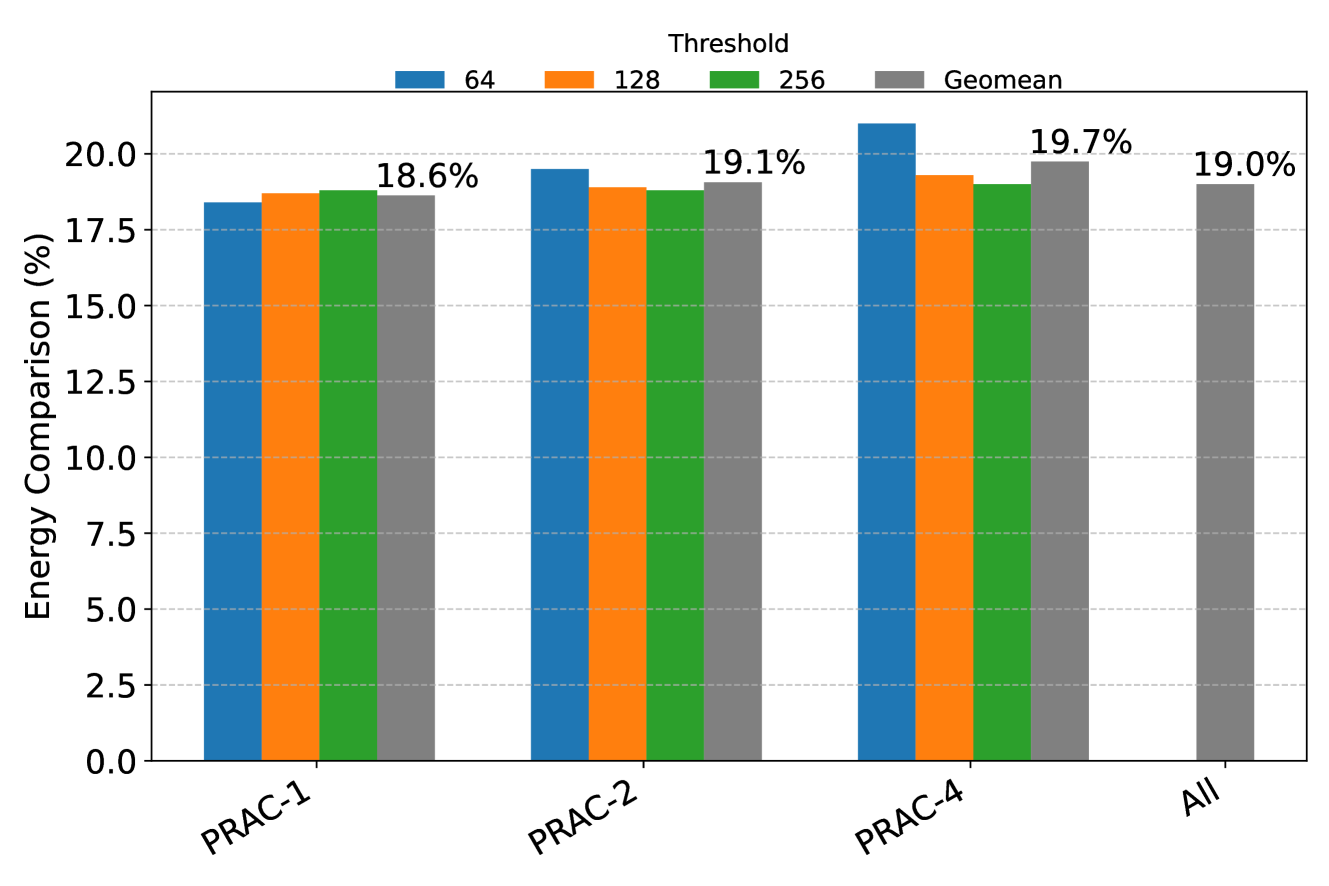
This bar chart compares energy comparison percentages across different PRAC (PRAC-1, PRAC-2, PRAC-4, and All) for various thresholds (64, 128, 256, and Geomean). The y-axis represents the energy comparison in percentage, while the x-axis represents the PRAC categories. Each PRAC category has four bars representing the energy comparison for each threshold.
### Components/Axes
* **X-axis:** PRAC (PRAC-1, PRAC-2, PRAC-4, All)
* **Y-axis:** Energy Comparison (%) - Scale ranges from 0.0 to 20.0, with tick marks every 2.5%.
* **Legend:** Located at the top-right corner, indicating the color-coding for each threshold:
* Blue: 64
* Orange: 128
* Green: 256
* Gray: Geomean
### Detailed Analysis
The chart consists of four groups of bars, one for each PRAC category. Within each group, there are four bars representing the energy comparison for thresholds 64, 128, 256, and Geomean.
**PRAC-1:**
* 64: Approximately 16.5%
* 128: Approximately 17.5%
* 256: Approximately 18.2%
* Geomean: 18.6%
**PRAC-2:**
* 64: Approximately 16.5%
* 128: Approximately 17.8%
* 256: Approximately 18.5%
* Geomean: 19.1%
**PRAC-4:**
* 64: Approximately 18.5%
* 128: Approximately 18.8%
* 256: Approximately 19.0%
* Geomean: 19.7%
**All:**
* 64: Approximately 16.5%
* 128: Approximately 17.8%
* 256: Approximately 18.5%
* Geomean: 19.7%
**Trends:**
* For each PRAC category, the energy comparison percentage generally increases as the threshold increases from 64 to 256, and is highest for the Geomean.
* PRAC-4 and "All" show the highest energy comparison percentages overall.
* The difference between the thresholds within each PRAC category is relatively small.
### Key Observations
* The Geomean consistently yields the highest energy comparison percentage across all PRAC categories.
* PRAC-4 and "All" have similar energy comparison percentages for all thresholds.
* PRAC-1 has the lowest energy comparison percentages across all thresholds.
* The energy comparison percentage for threshold 64 is consistently the lowest across all PRAC categories.
### Interpretation
The data suggests that using a Geomean threshold results in the highest energy comparison percentage, indicating a more efficient energy utilization or a more accurate measurement. PRAC-4 and the combined "All" PRACs demonstrate the highest energy comparison, potentially indicating that these PRACs are more optimized for energy efficiency or have a larger impact on overall energy comparison. The consistent trend of increasing energy comparison with higher thresholds suggests that higher thresholds may be more effective in capturing energy-related improvements. The relatively small differences between thresholds within each PRAC category suggest that the choice of threshold may not have a drastic impact on energy comparison, but the Geomean consistently provides the best results. The lower values for PRAC-1 suggest it may be less optimized or have different characteristics compared to the other PRACs.