\n
## Scatter Plots: AUROC vs. Accuracy for Model Evaluation Metrics
### Overview
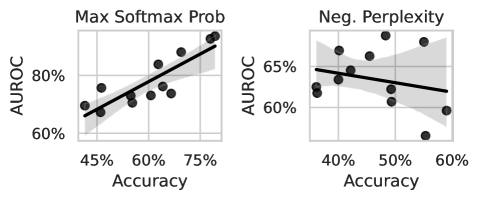
The image presents two scatter plots, side-by-side, comparing Accuracy against AUROC (Area Under the Receiver Operating Characteristic curve) for two different model evaluation metrics: "Max Softmax Prob" and "Neg. Perplexity". Each plot includes a regression line with a shaded confidence interval. The data points represent individual model evaluations.
### Components/Axes
Both plots share the following components:
* **X-axis:** Labeled "Accuracy", ranging from approximately 40% to 75%.
* **Y-axis:** Labeled "AUROC", ranging from approximately 60% to 85%.
* **Data Points:** Black circular markers representing individual data points.
* **Regression Line:** A black line representing the linear regression fit to the data.
* **Confidence Interval:** A light gray shaded area around the regression line, indicating the uncertainty in the regression fit.
The plots differ in their titles:
* **Left Plot:** Title "Max Softmax Prob"
* **Right Plot:** Title "Neg. Perplexity"
### Detailed Analysis or Content Details
**Left Plot: Max Softmax Prob**
The regression line slopes upward, indicating a positive correlation between Accuracy and AUROC.
* Approximate Data Points (Accuracy, AUROC):
* (45%, 63%)
* (50%, 68%)
* (52%, 70%)
* (55%, 72%)
* (58%, 74%)
* (60%, 75%)
* (62%, 77%)
* (65%, 79%)
* (70%, 82%)
* (75%, 85%)
**Right Plot: Neg. Perplexity**
The regression line slopes downward, indicating a negative correlation between Accuracy and AUROC.
* Approximate Data Points (Accuracy, AUROC):
* (40%, 67%)
* (45%, 66%)
* (48%, 65%)
* (50%, 64%)
* (52%, 63%)
* (55%, 62%)
* (58%, 60%)
* (60%, 58%)
### Key Observations
* **Positive Correlation (Max Softmax Prob):** Higher accuracy generally corresponds to higher AUROC for the "Max Softmax Prob" metric.
* **Negative Correlation (Neg. Perplexity):** Higher accuracy generally corresponds to lower AUROC for the "Neg. Perplexity" metric. This is counterintuitive, as both metrics should ideally increase with model performance.
* **Confidence Intervals:** The confidence intervals are relatively wide in both plots, suggesting substantial uncertainty in the regression estimates.
* **Data Distribution:** The data points are somewhat scattered around the regression lines, indicating that the linear relationship is not perfect.
### Interpretation
The plots suggest that "Max Softmax Prob" and "Neg. Perplexity" behave differently when evaluating model performance. "Max Softmax Prob" shows the expected positive correlation between accuracy and AUROC, indicating that as the model becomes more accurate, it also becomes better at distinguishing between classes (as measured by AUROC).
However, the negative correlation observed for "Neg. Perplexity" is concerning. A decrease in AUROC with increasing accuracy suggests that the "Neg. Perplexity" metric may be misleading or have limitations in this context. It could indicate that the metric is sensitive to factors other than true model performance, or that the model is overfitting to the training data in a way that improves accuracy but degrades its ability to generalize.
The wide confidence intervals highlight the need for more data to obtain more reliable estimates of the relationships between accuracy and AUROC for both metrics. Further investigation is needed to understand the underlying reasons for the negative correlation observed with "Neg. Perplexity". It's possible that the metric is not appropriate for this specific task or dataset.