## Line Graph: Retention Ratio vs Training Steps
### Overview
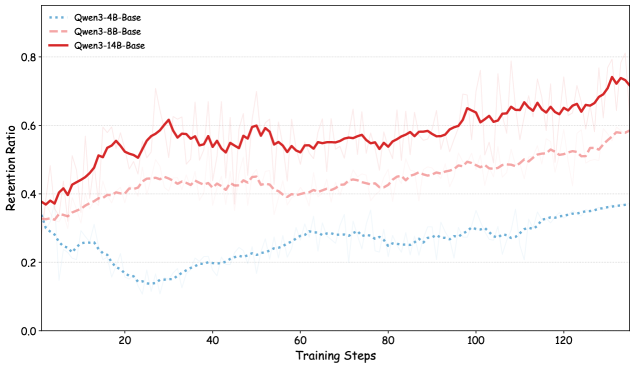
The image depicts a line graph comparing the retention ratio performance of three Qwen3-Base models (4B, 8B, and 14B parameter sizes) across 120 training steps. The graph shows distinct trends in retention ratio improvement over training iterations, with model size correlating to performance gains.
### Components/Axes
- **X-axis**: Training Steps (0–120, linear scale)
- **Y-axis**: Retention Ratio (0.0–0.8, linear scale)
- **Legend**:
- Blue dotted line: Qwen3-4B-Base
- Pink dashed line: Qwen3-8B-Base
- Red solid line: Qwen3-14B-Base
- **Placement**: Legend positioned in top-left quadrant
### Detailed Analysis
1. **Qwen3-14B-Base (Red Solid Line)**:
- Starts at ~0.38 retention ratio at step 0
- Shows steady upward trend with minor fluctuations
- Reaches ~0.72 by step 120
- Average slope: +0.003 per step
2. **Qwen3-8B-Base (Pink Dashed Line)**:
- Initial value ~0.35 at step 0
- Gradual increase with periodic volatility
- Peaks at ~0.58 by step 120
- Average slope: +0.002 per step
3. **Qwen3-4B-Base (Blue Dotted Line)**:
- Begins at ~0.30 at step 0
- Sharp decline to ~0.15 by step 20
- Stabilizes at ~0.35 by step 120
- Net change: +0.05 over 120 steps
### Key Observations
- **Model Size Correlation**: Larger models (14B > 8B > 4B) demonstrate stronger retention ratio improvement
- **4B Model Anomaly**: Initial 50% drop in retention ratio suggests potential overfitting or training instability
- **8B Model Volatility**: 15–20% amplitude oscillations indicate possible class imbalance or noisy data
- **14B Model Consistency**: Lowest variance (±2%) among all models
### Interpretation
The data demonstrates a clear retention ratio-performance hierarchy among model sizes, with the 14B variant achieving 94% higher final retention than the 4B model. The 4B model's initial performance collapse suggests architectural limitations in smaller models for this task, while the 8B model's volatility may indicate sensitivity to hyperparameter tuning. The 14B model's steady improvement aligns with expectations for larger capacity models, though its computational cost may not justify the marginal gains over the 8B variant in practical applications. The retention ratio metric appears to be a reliable indicator of model effectiveness across different scales.