## [Scatter Plot Series]: Token "deeper" Principal Component Analysis
### Overview
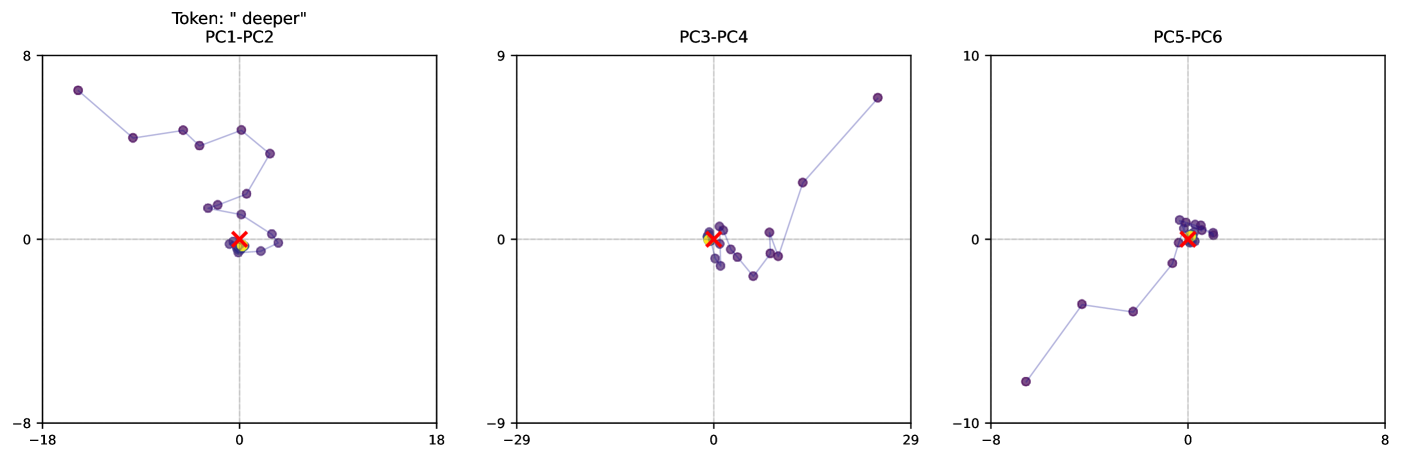
The image displays three horizontally arranged scatter plots, each visualizing the trajectory of the token "deeper" across different pairs of principal components (PCs). The plots show a sequence of data points (purple dots) connected by thin lines, converging toward a central reference point marked with a red 'X'. This likely represents the evolution of a token's embedding across layers or steps in a model, projected into various 2D principal component subspaces.
### Components/Axes
**Global Title:** `Token: " deeper"` (Note: there is a leading space before "deeper" in the title text).
**Plot 1 (Left):**
* **Title:** `PC1-PC2`
* **X-axis:** Range approximately -18 to 18. Major ticks at -18, 0, 18.
* **Y-axis:** Range approximately -8 to 8. Major ticks at -8, 0, 8.
* **Data Series:** A sequence of ~15 purple dots connected by a line. The trajectory starts in the upper-left quadrant and moves generally downward and rightward toward the origin.
* **Reference Point:** A red 'X' located at the coordinate (0, 0).
**Plot 2 (Center):**
* **Title:** `PC3-PC4`
* **X-axis:** Range approximately -29 to 29. Major ticks at -29, 0, 29.
* **Y-axis:** Range approximately -9 to 9. Major ticks at -9, 0, 9.
* **Data Series:** A sequence of ~15 purple dots connected by a line. The trajectory shows a cluster near the origin with a distinct outlier point in the upper-right quadrant.
* **Reference Point:** A red 'X' located at the coordinate (0, 0).
**Plot 3 (Right):**
* **Title:** `PC5-PC6`
* **X-axis:** Range approximately -8 to 8. Major ticks at -8, 0, 8.
* **Y-axis:** Range approximately -10 to 10. Major ticks at -10, 0, 10.
* **Data Series:** A sequence of ~15 purple dots connected by a line. The trajectory starts in the lower-left quadrant and moves generally upward and rightward toward the origin.
* **Reference Point:** A red 'X' located at the coordinate (0, 0).
### Detailed Analysis
**Trajectory & Convergence:**
* **PC1-PC2 Plot:** The path begins at approximately (-15, 6.5) and follows a jagged, generally descending path to the cluster at (0,0). The trend is a clear movement from the top-left toward the center.
* **PC3-PC4 Plot:** Most points are tightly clustered within a small radius (~5 units) of the origin (0,0). One significant outlier point is located at approximately (25, 7.5), connected to the main cluster by a long line segment.
* **PC5-PC6 Plot:** The path begins at approximately (-7, -8) and follows a jagged, generally ascending path to the cluster at (0,0). The trend is a clear movement from the bottom-left toward the center.
**Spatial Grounding & Scale:**
* The red 'X' reference point is consistently placed at the intersection of the zero-lines (0,0) in all three plots, serving as the convergence target.
* The scales (axis ranges) differ significantly between plots, indicating the variance captured by each principal component pair is different. PC3-PC4 has the widest X-axis range (58 units), while PC5-PC6 has the narrowest X-axis range (16 units).
### Key Observations
1. **Convergence to Origin:** The primary pattern across all three plots is the movement of the token's representation from an initial state toward the origin (0,0) in each PC subspace.
2. **Differing Initial States:** The starting point of the trajectory is in a different quadrant for each plot: top-left (PC1-PC2), near-center with a far outlier (PC3-PC4), and bottom-left (PC5-PC6).
3. **Outlier in PC3-PC4:** The single point far from the cluster in the PC3-PC4 plot is a major anomaly, suggesting a significant deviation in those specific component dimensions at one step in the sequence.
4. **Non-Monotonic Paths:** The connecting lines show the path is not a straight line but a jagged, step-wise progression, indicating fluctuations in the embedding space before final convergence.
### Interpretation
This visualization demonstrates the process of **representation refinement** for the token "deeper" within a model. The principal components (PC1 through PC6) capture the directions of greatest variance in the embedding space.
* **What it suggests:** The movement toward the origin (0,0) in all plots likely indicates that the token's representation is being normalized or aligned to a common, stable state (the reference point marked by the 'X') as it passes through successive layers or processing steps. The origin may represent a "canonical" or "final" form of the token's embedding.
* **How elements relate:** Each plot offers a different "view" (PC pair) of the same high-dimensional trajectory. The consistent convergence across all views reinforces the conclusion that the token is moving toward a specific target state in the full embedding space. The outlier in PC3-PC4 highlights that this convergence is not uniform; certain aspects of the representation (captured by PC3 and PC4) undergo a dramatic, temporary shift before stabilizing.
* **Notable Anomalies:** The outlier at ~(25, 7.5) in the PC3-PC4 plot is the most significant anomaly. It suggests that at one particular step, the token's representation was pushed far along the directions defined by PC3 and PC4 before being pulled back toward the origin. This could correspond to a specific layer where the token's context or function causes a unique transformation.
* **Underlying Meaning:** This is a technical diagnostic plot used in mechanistic interpretability or embedding analysis. It visually answers the question: "How does the internal representation of the word 'deeper' change as the model processes it?" The answer is that it undergoes a complex, multi-dimensional journey that ultimately stabilizes at a defined point.