\n
## Scatter Plot: Clinical Knowledge Confidence vs. Target Length
### Overview
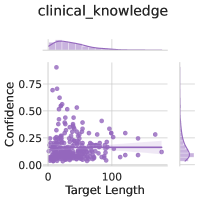
The image presents a scatter plot visualizing the relationship between "Target Length" and "Confidence" for "clinical_knowledge". A regression line is overlaid on the scatter plot, along with a density plot at the top. The plot suggests a weak or non-existent linear relationship between target length and confidence.
### Components/Axes
* **Title:** clinical\_knowledge (top-center)
* **X-axis:** Target Length (bottom-center), ranging from approximately 0 to 150.
* **Y-axis:** Confidence (left-center), ranging from approximately 0.00 to 0.75.
* **Scatter Plot:** Purple dots representing individual data points.
* **Regression Line:** A dark purple line representing the linear trend.
* **Density Plot:** A purple shaded area at the top of the chart, representing the distribution of confidence values.
### Detailed Analysis
The scatter plot shows a large number of data points clustered near the bottom of the chart, with confidence values generally between 0.05 and 0.25. As "Target Length" increases from 0 to approximately 100, there is a slight upward trend in confidence, but it is very weak. Beyond a "Target Length" of 100, the confidence values become more scattered, with no clear trend.
The regression line is nearly horizontal, indicating a very small slope. The line appears to be centered around a confidence value of approximately 0.20.
The density plot at the top shows a concentration of confidence values around 0.20-0.30, with a tail extending towards lower confidence values.
Here's an approximate extraction of data points (due to the resolution and density of the plot, these are estimates):
* Target Length = 0, Confidence ≈ 0.15 - 0.25 (multiple points)
* Target Length = 50, Confidence ≈ 0.10 - 0.30 (multiple points)
* Target Length = 100, Confidence ≈ 0.05 - 0.40 (multiple points)
* Target Length = 150, Confidence ≈ 0.00 - 0.30 (multiple points)
### Key Observations
* The relationship between "Target Length" and "Confidence" appears to be very weak.
* The majority of data points have low confidence values (below 0.30).
* There is no strong correlation between the two variables.
* The density plot confirms that the most common confidence values are in the lower range.
### Interpretation
The data suggests that the length of the target does not significantly influence the confidence level for "clinical_knowledge". The nearly flat regression line and the weak scatter suggest that other factors are likely more important in determining confidence. The concentration of data points at low confidence levels could indicate inherent uncertainty or difficulty in assessing clinical knowledge. The density plot reinforces this, showing a peak in the lower confidence range. The lack of a clear trend implies that simply increasing the target length does not necessarily lead to higher confidence in the clinical knowledge assessment. This could be due to the complexity of clinical knowledge, the limitations of the assessment method, or the presence of confounding variables.