## Scatter Plot: Accuracy vs. Time-to-Answer (Longest Thinking in Thousands)
### Overview
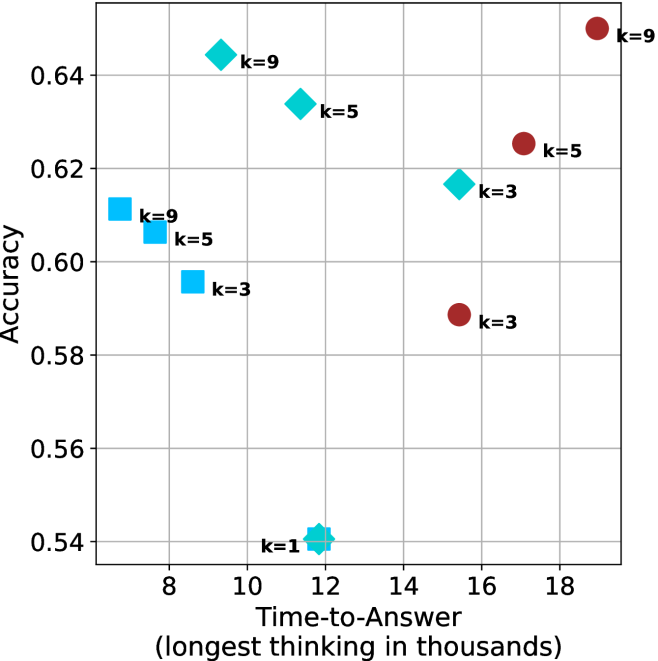
The image is a scatter plot comparing **accuracy** (y-axis) and **time-to-answer** (x-axis, in thousands of units) for different configurations labeled by `k` values. Data points are color-coded and marked with distinct symbols (squares, circles, diamonds, stars) corresponding to `k=1`, `k=3`, `k=5`, and `k=9`. The plot highlights trade-offs between accuracy and computational time across configurations.
---
### Components/Axes
- **Y-Axis (Accuracy)**: Ranges from 0.54 to 0.64, with gridlines at 0.56, 0.58, 0.60, 0.62, and 0.64.
- **X-Axis (Time-to-Answer)**: Ranges from 8 to 18 (in thousands), with gridlines at 8, 10, 12, 14, 16, and 18.
- **Legend**: Located on the right, associating:
- **Blue squares**: `k=3`
- **Red circles**: `k=3`
- **Cyan diamonds**: `k=5`
- **Magenta stars**: `k=9`
- **Data Points**: Scattered across the plot, with labels indicating `k` values and approximate coordinates.
---
### Detailed Analysis
#### Data Points by `k` Value
1. **`k=1` (Blue Star)**:
- Single point at `(12, 0.54)`.
- Lowest accuracy and moderate time-to-answer.
2. **`k=3` (Blue Squares and Red Circles)**:
- **Blue Squares**:
- `(9, 0.60)`
- `(10, 0.59)`
- **Red Circles**:
- `(16, 0.58)`
- `(18, 0.58)`
- **Trend**: Accuracy decreases slightly as time increases (e.g., 0.60 → 0.58).
3. **`k=5` (Cyan Diamonds and Red Circles)**:
- **Cyan Diamonds**:
- `(8, 0.61)`
- `(10, 0.63)`
- **Red Circles**:
- `(17, 0.62)`
- **Trend**: Higher accuracy (0.61–0.63) with longer time-to-answer (8–17k).
4. **`k=9` (Cyan Diamonds and Magenta Stars)**:
- **Cyan Diamonds**:
- `(9, 0.64)`
- **Magenta Stars**:
- `(18, 0.64)`
- **Trend**: Highest accuracy (0.64) but longest time-to-answer (9–18k).
---
### Key Observations
1. **Accuracy-Time Trade-off**:
- Higher `k` values (e.g., `k=9`) achieve higher accuracy but require significantly more time.
- Lower `k` values (e.g., `k=1`) have lower accuracy but faster computation.
2. **Inconsistencies**:
- **Cyan Diamonds**: Labeled as `k=5` in the legend but include a point `(9, 0.64)` labeled `k=9`.
- **Red Circles**: Labeled as `k=3` in the legend but include a point `(17, 0.62)` labeled `k=5`.
- These discrepancies suggest potential labeling errors in the original data.
3. **Outliers**:
- The `k=1` point `(12, 0.54)` is an outlier with the lowest accuracy.
- The `k=9` point `(18, 0.64)` represents the maximum time-to-answer and highest accuracy.
---
### Interpretation
The plot demonstrates a clear trade-off between **accuracy** and **computational cost**. Configurations with higher `k` values (e.g., `k=9`) prioritize accuracy at the expense of longer processing time, while lower `k` values (e.g., `k=1`) optimize for speed but sacrifice precision.
- **`k=3` and `k=5`** occupy intermediate positions, balancing accuracy and time. However, the inconsistent labeling of data points (e.g., `k=9` mislabeled as `k=5`) raises questions about data integrity.
- The `k=1` configuration’s low accuracy (0.54) suggests it may be unsuitable for tasks requiring high precision, even if it is the fastest option.
This analysis underscores the importance of tuning `k` based on application-specific priorities (e.g., real-time vs. high-accuracy requirements). Further validation of the dataset is recommended to resolve labeling inconsistencies.