\n
## Scatter Plot: GLUE Score vs. Date & GFLOPs
### Overview
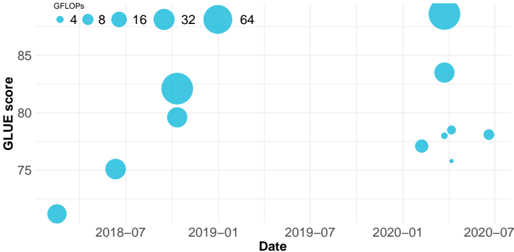
This image presents a scatter plot visualizing the relationship between the GLUE score, date, and GFLOPs (floating point operations per second). The plot displays data points representing models evaluated on the GLUE benchmark over time, with the size of each point indicating the model's computational cost in GFLOPs.
### Components/Axes
* **X-axis:** Date, ranging from approximately July 2018 to July 2020. The axis is labeled "Date".
* **Y-axis:** GLUE score, ranging from approximately 73 to 83. The axis is labeled "GLUE score".
* **Point Size:** Represents GFLOPs, with a legend indicating the following mapping:
* 4 GFLOPs (Smallest circle)
* 8 GFLOPs
* 16 GFLOPs
* 32 GFLOPs
* 64 GFLOPs (Largest circle)
* **Legend:** Located in the top-right corner of the plot.
### Detailed Analysis
The plot shows a general trend of increasing GLUE scores over time. The size of the data points (representing GFLOPs) also generally increases with the GLUE score, but this relationship is not strictly linear.
Here's a breakdown of the data points, approximating values based on visual inspection:
* **2018-07:** GLUE score ≈ 73, GFLOPs ≈ 4
* **2018-10:** GLUE score ≈ 75, GFLOPs ≈ 8
* **2019-01:** GLUE score ≈ 78, GFLOPs ≈ 16
* **2019-04:** GLUE score ≈ 80, GFLOPs ≈ 32
* **2019-07:** GLUE score ≈ 81, GFLOPs ≈ 32
* **2019-10:** GLUE score ≈ 82, GFLOPs ≈ 64
* **2020-01:** GLUE score ≈ 77, GFLOPs ≈ 32
* **2020-01:** GLUE score ≈ 82, GFLOPs ≈ 64
* **2020-04:** GLUE score ≈ 76, GFLOPs ≈ 8
* **2020-04:** GLUE score ≈ 78, GFLOPs ≈ 16
* **2020-07:** GLUE score ≈ 78, GFLOPs ≈ 16
* **2020-07:** GLUE score ≈ 80, GFLOPs ≈ 32
### Key Observations
* There's a positive correlation between GFLOPs and GLUE score, suggesting that more computationally expensive models generally achieve higher scores.
* The largest GFLOPs values (64) are associated with the highest GLUE scores (around 82).
* There is some variance in GLUE scores for models with similar GFLOPs values, indicating that computational cost is not the only factor determining performance.
* The data suggests a plateauing of GLUE score improvement in the later stages (2020), despite continued increases in GFLOPs.
### Interpretation
The data demonstrates the trade-off between model size (measured in GFLOPs) and performance (measured by GLUE score) in natural language processing. Initially, increasing model size leads to significant improvements in GLUE score. However, the rate of improvement appears to diminish as models become larger, suggesting diminishing returns. This could be due to factors such as data limitations, optimization challenges, or the inherent complexity of the tasks included in the GLUE benchmark. The plateauing trend in 2020 might indicate that the current approaches are reaching their limits, and new architectures or training techniques are needed to achieve further gains. The scatter plot effectively visualizes this relationship, allowing for a quick assessment of the performance-cost trade-offs for different models.