## Line Chart: Attention over Values, a=20
### Overview
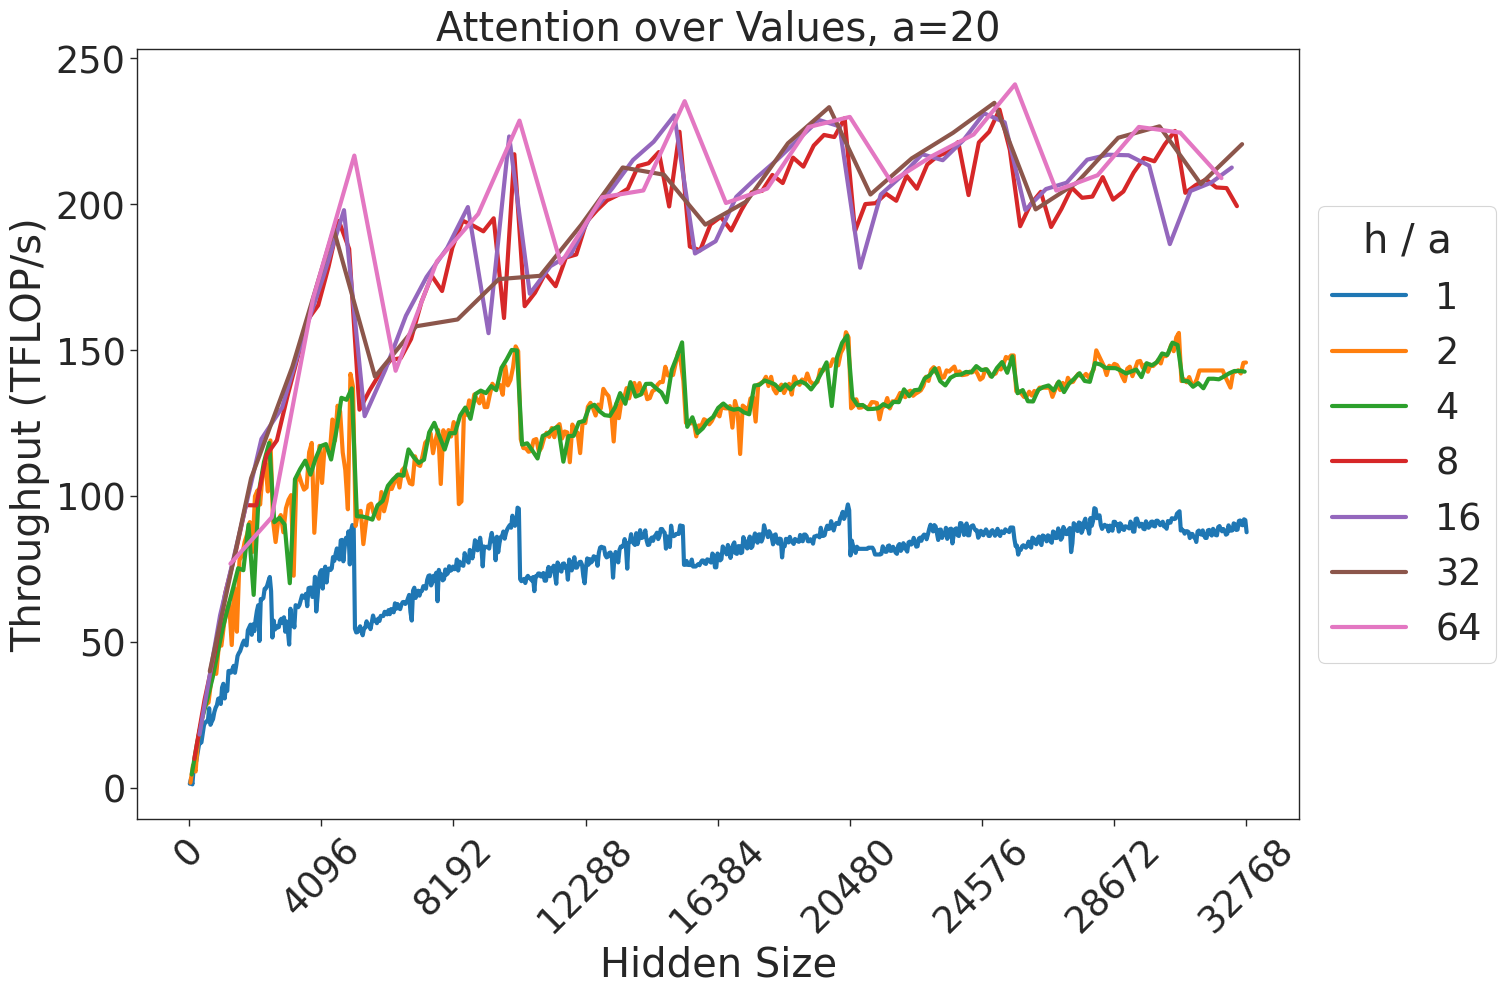
This chart illustrates the throughput performance (measured in TFLOP/s) of a computational process—likely a neural network attention mechanism—as a function of "Hidden Size." The data is segmented by different "h / a" ratios, ranging from 1 to 64. The chart reveals a general upward trend in throughput as the hidden size increases, characterized by significant, periodic performance drops (sawtooth patterns) across all data series.
### Components/Axes
* **Title:** "Attention over Values, a=20" (Centered at the top).
* **Y-Axis:** "Throughput (TFLOP/s)". The scale ranges from 0 to 250.
* **X-Axis:** "Hidden Size". The scale ranges from 0 to 32768, with major tick marks at intervals of 4096 (0, 4096, 8192, 12288, 16384, 20480, 24576, 28672, 32768).
* **Legend:** Positioned on the right side of the chart. It maps "h / a" ratios to specific line colors:
* **Blue:** 1
* **Orange:** 2
* **Green:** 4
* **Red:** 8
* **Purple:** 16
* **Brown:** 32
* **Pink:** 64
### Detailed Analysis
The data series can be grouped into three distinct performance tiers based on their throughput levels:
1. **Low Performance Tier (Blue, h/a=1):**
* **Trend:** Slopes upward from 0 to ~90 TFLOP/s at the maximum hidden size.
* **Characteristics:** This line is consistently the lowest. It exhibits frequent, smaller sawtooth drops compared to the higher tiers.
2. **Medium Performance Tier (Orange, h/a=2; Green, h/a=4):**
* **Trend:** These two lines are almost perfectly overlapping. They rise sharply from 0 to ~100 TFLOP/s at a hidden size of ~4000, then continue a slower, oscillating climb to ~140-150 TFLOP/s at the maximum hidden size.
* **Characteristics:** The overlap suggests that for this specific operation, the performance difference between h/a=2 and h/a=4 is negligible.
3. **High Performance Tier (Red, h/a=8; Purple, h/a=16; Brown, h/a=32; Pink, h/a=64):**
* **Trend:** These lines are tightly clustered at the top of the chart. They show the steepest initial growth, reaching ~200 TFLOP/s quickly, and peak near 240 TFLOP/s.
* **Characteristics:** These lines exhibit the most pronounced and regular "sawtooth" patterns. The performance drops are sharp and occur at regular intervals, indicating significant sensitivity to specific hidden size values.
### Key Observations
* **Sawtooth Pattern:** Every data series exhibits periodic, sharp drops in throughput. These drops are highly regular, suggesting that the performance is constrained by hardware-specific alignment (e.g., memory block sizes, warp/wavefront sizes, or cache line boundaries).
* **Diminishing Returns:** While increasing the "h/a" ratio from 1 to 8 yields significant throughput gains, increasing the ratio beyond 8 (to 16, 32, or 64) results in minimal additional performance improvement, as these lines are clustered very closely together.
* **Saturation:** The overall throughput growth rate slows down as the hidden size increases, suggesting the system approaches a compute-bound state at higher hidden sizes.
### Interpretation
The data demonstrates that this specific attention kernel is highly sensitive to the "Hidden Size" parameter. The "sawtooth" behavior is a classic indicator of memory alignment or block-size efficiency issues in GPU/accelerator programming.
The clustering of the higher "h/a" ratios (8 through 64) suggests that once a certain ratio is achieved, the system is likely compute-bound, and further increasing the ratio provides little benefit. Conversely, the performance gap between the "Low" and "High" tiers indicates that the "h/a" ratio is a critical hyperparameter for optimizing throughput. Users of this system should avoid hidden sizes that fall into the "valleys" of the sawtooth pattern to maintain peak performance.