# Technical Document Extraction: Comparing PRM Aggregation Strategies
## 1. Document Metadata
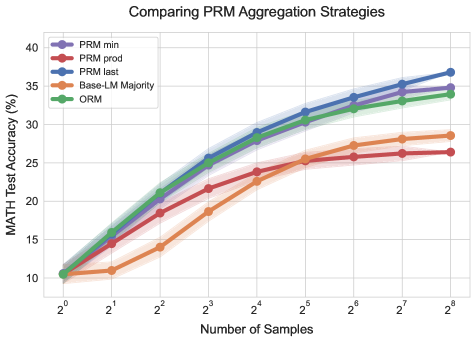
* **Title:** Comparing PRM Aggregation Strategies
* **Type:** Line Graph with shaded confidence intervals
* **Language:** English
## 2. Component Isolation
### Header
* **Main Title:** Comparing PRM Aggregation Strategies
### Main Chart Area
* **Y-Axis Label:** MATH Test Accuracy (%)
* **Y-Axis Scale:** Linear, ranging from 10 to 40 with increments of 5.
* **X-Axis Label:** Number of Samples
* **X-Axis Scale:** Logarithmic (base 2), ranging from $2^0$ (1) to $2^8$ (256).
* **Grid:** Major grid lines present for both X and Y axes.
### Legend [Top-Left Placement]
The legend identifies five distinct data series, each represented by a colored line with circular markers and a corresponding shaded error band.
1. **PRM min** (Purple)
2. **PRM prod** (Red)
3. **PRM last** (Blue)
4. **Base-LM Majority** (Orange)
5. **ORM** (Green)
---
## 3. Data Series Analysis and Trend Verification
All series exhibit a positive correlation between the number of samples and test accuracy, following a logarithmic growth curve that begins to flatten as it approaches $2^8$ samples.
| Series Label | Color | Visual Trend Description | Final Performance Rank |
| :--- | :--- | :--- | :--- |
| **PRM last** | Blue | Steepest initial climb; maintains the highest accuracy across the majority of the sample range. | 1st |
| **PRM min** | Purple | Closely follows "PRM last" and "ORM"; finishes slightly below "PRM last". | 2nd |
| **ORM** | Green | Strong performance, initially overlapping with PRM methods but falling slightly behind "PRM last" and "PRM min" at higher sample counts. | 3rd |
| **Base-LM Majority** | Orange | Slowest initial growth; shows a significant upward inflection between $2^2$ and $2^6$, eventually overtaking "PRM prod". | 4th |
| **PRM prod** | Red | Steady growth initially, but plateaus much earlier than other methods, resulting in the lowest final accuracy. | 5th |
---
## 4. Extracted Data Points (Approximate Values)
The following table reconstructs the data based on the visual alignment of markers against the axes. All values are percentages (%).
| Number of Samples ($2^x$) | PRM last (Blue) | PRM min (Purple) | ORM (Green) | Base-LM Majority (Orange) | PRM prod (Red) |
| :--- | :--- | :--- | :--- | :--- | :--- |
| **$2^0$ (1)** | ~10.5 | ~10.5 | ~10.5 | ~10.5 | ~10.5 |
| **$2^1$ (2)** | ~15.5 | ~15.0 | ~16.0 | ~11.0 | ~14.5 |
| **$2^2$ (4)** | ~21.0 | ~20.5 | ~21.0 | ~14.0 | ~18.5 |
| **$2^3$ (8)** | ~25.5 | ~25.0 | ~25.0 | ~18.5 | ~21.5 |
| **$2^4$ (16)** | ~29.0 | ~28.0 | ~28.0 | ~22.5 | ~23.5 |
| **$2^5$ (32)** | ~31.5 | ~30.5 | ~30.5 | ~25.5 | ~25.0 |
| **$2^6$ (64)** | ~33.5 | ~32.5 | ~32.0 | ~27.0 | ~25.5 |
| **$2^7$ (128)** | ~35.0 | ~34.0 | ~33.0 | ~28.0 | ~26.0 |
| **$2^8$ (256)** | ~36.5 | ~34.5 | ~34.0 | ~28.5 | ~26.5 |
---
## 5. Key Findings
* **Top Performer:** **PRM last** is the most effective aggregation strategy for MATH test accuracy as sample size increases, reaching approximately 36.5%.
* **Baseline Comparison:** All PRM/ORM strategies significantly outperform the **Base-LM Majority** vote at low sample counts ($2^1$ to $2^4$).
* **Inefficient Strategy:** **PRM prod** (Product) scales poorly compared to other PRM methods, eventually being surpassed by the simple Base-LM Majority at approximately $2^5$ (32) samples.
* **Convergence:** **PRM min** and **ORM** perform very similarly throughout the range, with PRM min showing a slight edge at the highest sample count.