\n
## Violin Plot: High School Biology Accuracy
### Overview
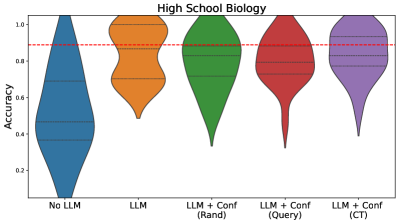
The image presents a violin plot comparing the accuracy of different approaches to answering high school biology questions. The approaches are: "No LLM", "LLM", "LLM + Conf (Rand)", "LLM + Conf (Query)", and "LLM + Conf (CT)". A horizontal dashed line indicates a benchmark accuracy level of approximately 0.8.
### Components/Axes
* **Title:** "High School Biology" positioned at the top-center of the plot.
* **Y-axis:** Labeled "Accuracy", ranging from approximately 0.2 to 1.0, with increments of 0.2.
* **X-axis:** Categorical, representing the different approaches:
* "No LLM"
* "LLM"
* "LLM + Conf (Rand)" - LLM plus Confidence (Random)
* "LLM + Conf (Query)" - LLM plus Confidence (Query)
* "LLM + Conf (CT)" - LLM plus Confidence (Chain of Thought)
* **Horizontal Line:** A dashed red line at approximately y = 0.8, likely representing a threshold or benchmark accuracy.
* **Violin Plots:** Each approach is represented by a violin plot, showing the distribution of accuracy scores.
### Detailed Analysis
The violin plots show the distribution of accuracy scores for each approach.
* **No LLM (Blue):** The violin plot is centered around approximately 0.5, with a wide distribution ranging from roughly 0.2 to 1.0. The plot is relatively broad, indicating a high variance in accuracy.
* **LLM (Orange):** The violin plot is centered around approximately 0.85, with a narrower distribution than "No LLM", ranging from about 0.6 to 1.0.
* **LLM + Conf (Rand) (Green):** The violin plot is centered around approximately 0.9, with a distribution ranging from roughly 0.65 to 1.0. It is slightly wider than the "LLM" plot.
* **LLM + Conf (Query) (Red):** The violin plot is centered around approximately 0.75, with a distribution ranging from about 0.5 to 0.95. It appears to have a longer tail towards lower accuracy scores.
* **LLM + Conf (CT) (Purple):** The violin plot is centered around approximately 0.95, with a relatively narrow distribution ranging from about 0.8 to 1.0. This plot is the most concentrated around higher accuracy values.
The dashed red line at 0.8 serves as a visual benchmark. The "No LLM" and "LLM + Conf (Query)" plots have significant portions below this line, while the other three approaches generally perform above it.
### Key Observations
* Using an LLM significantly improves accuracy compared to "No LLM".
* "LLM + Conf (CT)" consistently achieves the highest accuracy, with the most concentrated distribution around high values.
* "LLM + Conf (Query)" shows the most variability and has a substantial portion of scores below the 0.8 benchmark.
* "LLM + Conf (Rand)" performs slightly better than the base "LLM" model.
### Interpretation
The data suggests that incorporating Large Language Models (LLMs) substantially enhances accuracy in answering high school biology questions. Furthermore, the method of confidence scoring significantly impacts performance. "Chain of Thought" (CT) confidence scoring appears to be the most effective, leading to the highest and most consistent accuracy. Random confidence scoring provides a modest improvement over the base LLM, while Query-based confidence scoring is the least effective, exhibiting the greatest variance and a substantial number of low-accuracy results.
The violin plots reveal not only the central tendency of accuracy for each method but also the spread of results. The narrowness of the "LLM + Conf (CT)" plot indicates a reliable and consistent performance, while the broader plots for "No LLM" and "LLM + Conf (Query)" suggest greater uncertainty and potential for both high and low accuracy outcomes. The horizontal line provides a clear benchmark for evaluating the practical utility of each approach. The fact that "No LLM" performs significantly below this line highlights the value of LLM integration.