## Line Graphs: Harmfulness Metrics Across Model Sizes and Thinking Components
### Overview
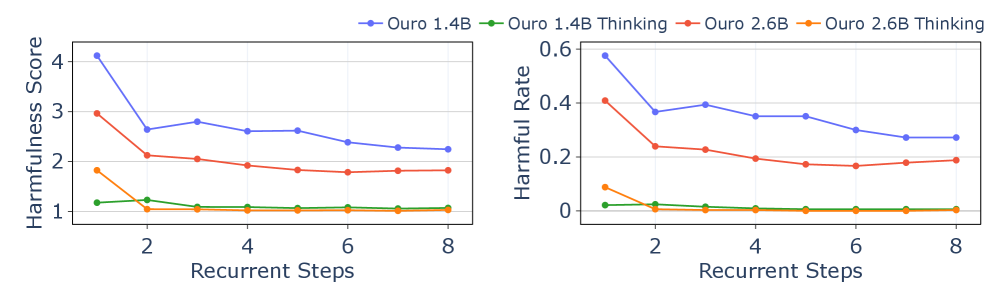
The image contains two side-by-side line graphs comparing harmfulness metrics (Harmfulness Score and Harmful Rate) across four model configurations: Ouro 1.4B, Ouro 1.4B Thinking, Ouro 2.6B, and Ouro 2.6B Thinking. Both graphs plot these metrics against "Recurrent Steps" (x-axis) ranging from 2 to 8. The left graph uses a y-axis scale of 0–4 for Harmfulness Score, while the right graph uses 0–0.6 for Harmful Rate.
---
### Components/Axes
- **X-Axis (Both Graphs)**: "Recurrent Steps" (values: 2, 4, 6, 8).
- **Left Y-Axis**: "Harmfulness Score" (scale: 0–4).
- **Right Y-Axis**: "Harmful Rate" (scale: 0–0.6).
- **Legend**: Located at the top, with four color-coded lines:
- **Blue**: Ouro 1.4B
- **Green**: Ouro 1.4B Thinking
- **Red**: Ouro 2.6B
- **Orange**: Ouro 2.6B Thinking
---
### Detailed Analysis
#### Left Graph (Harmfulness Score)
1. **Ouro 1.4B (Blue)**:
- Starts at ~4.0 at step 2, sharply declines to ~2.5 by step 8.
- Trend: Steep initial drop, then gradual flattening.
2. **Ouro 2.6B (Red)**:
- Starts at ~3.0 at step 2, declines to ~1.8 by step 8.
- Trend: Steady linear decrease.
3. **Ouro 1.4B Thinking (Green)**:
- Remains flat at ~1.0 across all steps.
4. **Ouro 2.6B Thinking (Orange)**:
- Remains flat at ~0.1 across all steps.
#### Right Graph (Harmful Rate)
1. **Ouro 1.4B (Blue)**:
- Starts at ~0.6 at step 2, declines to ~0.25 by step 8.
- Trend: Steep initial drop, then gradual flattening.
2. **Ouro 2.6B (Red)**:
- Starts at ~0.4 at step 2, declines to ~0.18 by step 8.
- Trend: Steady linear decrease.
3. **Ouro 1.4B Thinking (Green)**:
- Remains flat at ~0.02 across all steps.
4. **Ouro 2.6B Thinking (Orange)**:
- Remains flat at ~0.01 across all steps.
---
### Key Observations
1. **Model Size Impact**:
- Larger models (2.6B) consistently show lower harmfulness metrics than smaller models (1.4B) at all steps.
2. **Thinking Component Effect**:
- "Thinking" variants (green/orange) exhibit significantly lower harmfulness scores/rates, remaining nearly constant regardless of steps.
3. **Step Dependency**:
- Harmfulness metrics decrease with more recurrent steps for non-Thinking models, but plateau after step 4.
4. **Metric Relationship**:
- Harmful Rate (right graph) is approximately 1/10th of Harmfulness Score (left graph) for corresponding models.
---
### Interpretation
The data suggests that:
- **Model Size**: Larger models (2.6B) inherently produce less harmful outputs than smaller models (1.4B), even without additional components.
- **Thinking Component**: The "Thinking" variant drastically reduces harmfulness, maintaining near-zero metrics across all steps. This implies the Thinking component acts as a robust safety mechanism.
- **Recurrent Steps**: While increasing steps reduces harmfulness for non-Thinking models, the effect diminishes after step 4. This could indicate diminishing returns in safety improvements from additional steps.
- **Metric Scaling**: The Harmful Rate metric (right graph) appears to normalize Harmfulness Score, but the exact relationship requires further analysis.
Notably, the Thinking variants’ stability across steps suggests they are less sensitive to architectural changes (e.g., recurrent steps), making them potentially more reliable for safety-critical applications.