## Line Chart: Attention over Values, a=512
### Overview
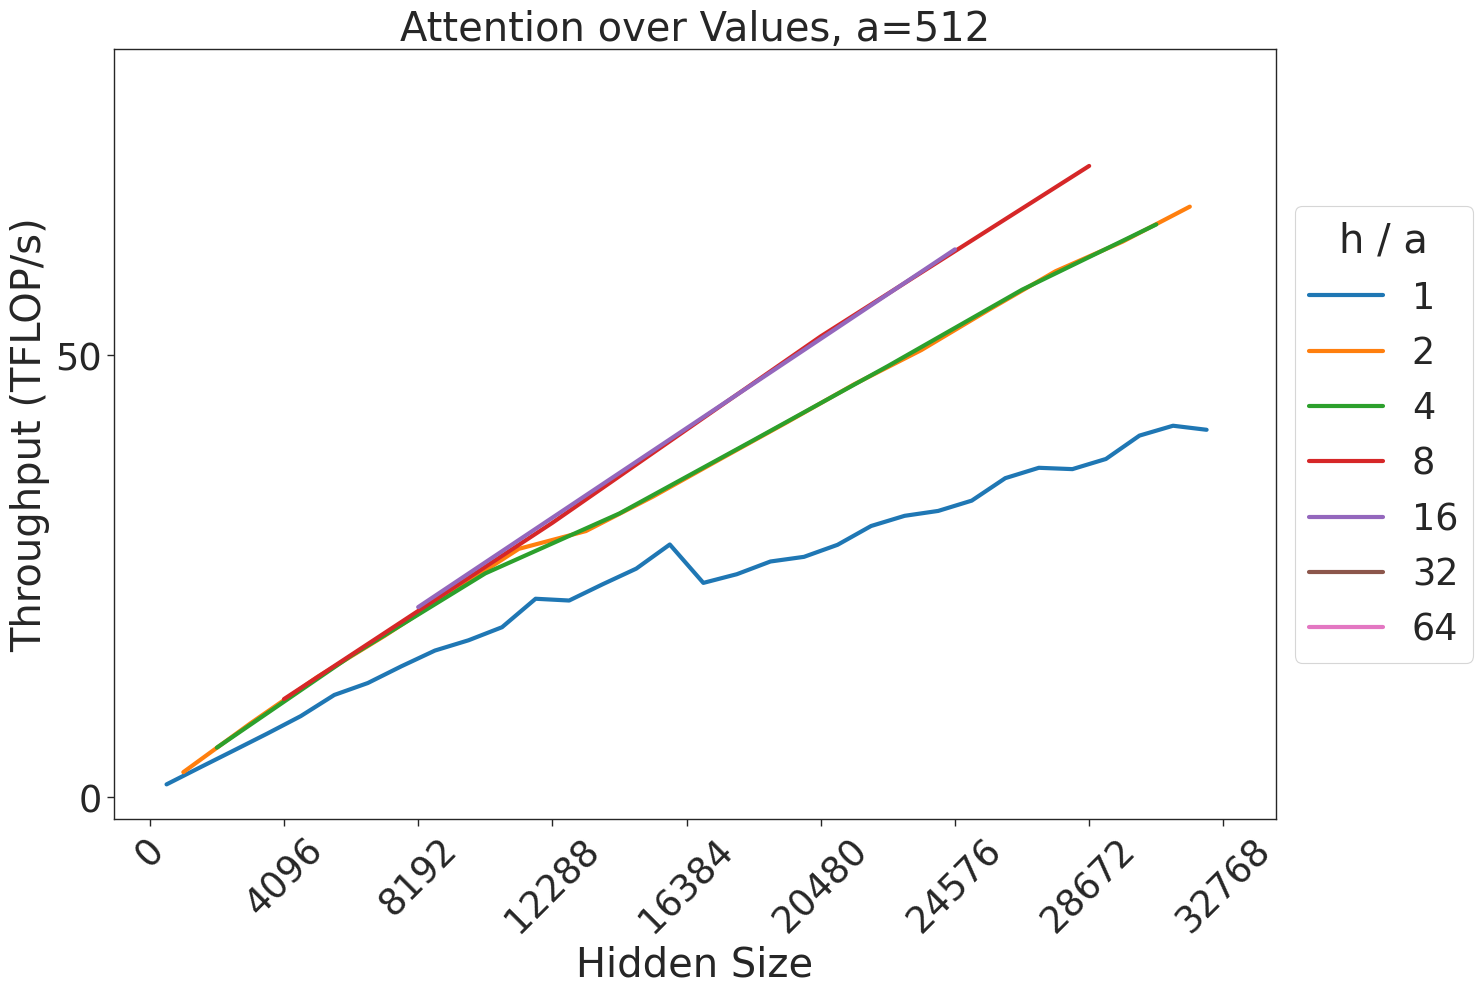
This image is a line chart illustrating the relationship between "Hidden Size" (x-axis) and "Throughput (TFLOP/s)" (y-axis) for various `h/a` ratios. The chart demonstrates how different configurations of attention mechanisms affect computational throughput as the hidden size of the model increases.
### Components/Axes
* **Title:** "Attention over Values, a=512" (Top center)
* **X-Axis:** "Hidden Size". The scale ranges from 0 to 32768, with major tick marks at intervals of 4096 (0, 4096, 8192, 12288, 16384, 20480, 24576, 28672, 32768).
* **Y-Axis:** "Throughput (TFLOP/s)". The scale ranges from 0 to slightly above 50 (implied by the tick mark at 50, with the graph extending higher).
* **Legend:** Located on the right side, vertically centered. It is titled "h / a" and lists the following ratios with corresponding line colors:
* **1**: Blue
* **2**: Orange
* **4**: Green
* **8**: Red
* **16**: Purple
* **32**: Brown
* **64**: Pink
### Detailed Analysis
The chart displays five visible data series. Note that the legend includes values for 32 (Brown) and 64 (Pink), but these lines are not visible on the plot, suggesting they may not have been successfully computed or plotted.
**Trend Verification & Data Points:**
* **Blue Line (h/a = 1):**
* *Trend:* Slopes upward consistently from 0 to 32768. The line is notably jagged/noisy compared to the others.
* *Values:* Starts at 0. At 16384, it is approximately 25 TFLOP/s. At 32768, it reaches approximately 40 TFLOP/s.
* **Orange Line (h/a = 2):**
* *Trend:* Slopes upward linearly.
* *Values:* At 16384, it is approximately 40 TFLOP/s. At 32768, it reaches approximately 75 TFLOP/s.
* **Green Line (h/a = 4):**
* *Trend:* Slopes upward linearly, tracking very closely with the Orange line.
* *Values:* At 16384, it is approximately 40 TFLOP/s. At 32768, it reaches approximately 75 TFLOP/s.
* **Red Line (h/a = 8):**
* *Trend:* Slopes upward linearly. It terminates at approximately 28672.
* *Values:* At 16384, it is approximately 45 TFLOP/s. At 28672, it reaches approximately 85 TFLOP/s.
* **Purple Line (h/a = 16):**
* *Trend:* Slopes upward linearly. It terminates earlier than the Red line, at approximately 24576.
* *Values:* At 16384, it is approximately 45 TFLOP/s. At 24576, it reaches approximately 85 TFLOP/s.
### Key Observations
1. **Termination Points (OOM):** The lines for higher `h/a` ratios (8 and 16) terminate before reaching the maximum hidden size of 32768. This is a classic indicator of "Out of Memory" (OOM) errors, where the computational requirements for these configurations exceed the available hardware memory as the hidden size increases.
2. **Throughput Efficiency:** Higher `h/a` ratios yield higher throughput (TFLOP/s) for a given hidden size. The Red (8) and Purple (16) lines show the highest throughput before they terminate.
3. **Noise:** The Blue line (h/a = 1) exhibits significant "stair-stepping" or jagged behavior, suggesting instability or inefficient utilization of the compute units compared to the smoother, higher-throughput lines.
4. **Missing Data:** The legend entries for 32 and 64 are not represented by any lines on the graph, implying that these configurations were likely unable to run at all on the tested hardware.
### Interpretation
The data demonstrates a clear trade-off between computational throughput and memory capacity.
* **Performance vs. Capacity:** Increasing the `h/a` ratio significantly boosts throughput (the slope of the lines is steeper for higher ratios). However, this comes at the cost of memory footprint; as the hidden size increases, the configurations with higher `h/a` ratios run out of memory and crash (terminate) earlier.
* **Stability:** The Blue line (h/a = 1) is the only configuration capable of running across the entire range of hidden sizes (up to 32768), making it the most "stable" or "robust" configuration, albeit with the lowest performance.
* **Optimization:** The convergence of the Orange (2) and Green (4) lines suggests that beyond a certain point, increasing the `h/a` ratio provides diminishing returns in terms of throughput, or that the hardware is hitting a bottleneck that limits the performance gains of higher ratios.