\n
## Diagram: Flowchart of Video Script Generation and Visualization Check
### Overview
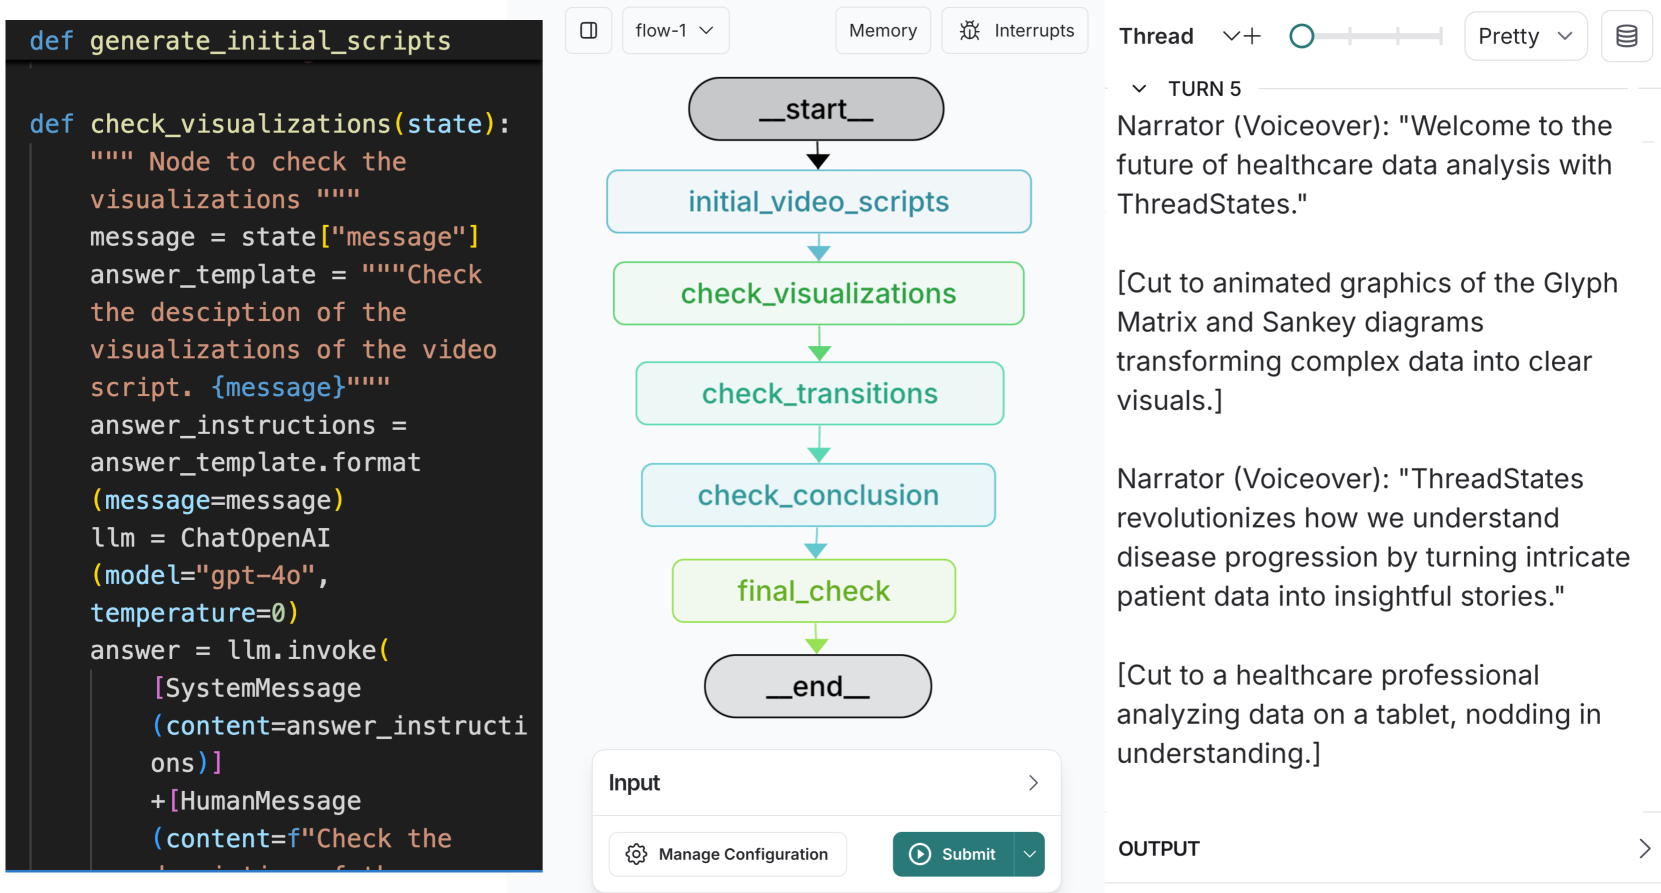
This image depicts a flowchart illustrating the process of generating initial video scripts, checking visualizations within those scripts, and finalizing the script. The flowchart uses rounded rectangles to represent process steps and arrows to indicate the flow of execution. The right side of the image shows a transcript of a voiceover narration associated with the process.
### Components/Axes
The diagram consists of the following components:
* **Start Node:** Labeled "_start_"
* **Process Nodes:**
* "initial_video_scripts"
* "check_visualizations"
* "check_transitions"
* "check_conclusion"
* "final_check"
* "_end_"
* **Input Node:** Labeled "Input"
* **Arrows:** Indicate the flow direction between nodes.
* **Right Panel:** Contains a transcript of "TURN 5" with "Narrator (Voiceover)" and associated scene descriptions.
* **Top Bar:** Contains controls for "flow-1", "Memory", "Interrupts", "Thread", "+", "O", and "Pretty".
* **Bottom Bar:** Contains "Manage Configuration" and "Submit" buttons.
### Detailed Analysis or Content Details
The flowchart demonstrates a linear process:
1. The process begins at "_start_".
2. It proceeds to "initial_video_scripts".
3. Next, it moves to "check_visualizations".
4. Then to "check_transitions".
5. Followed by "check_conclusion".
6. Then to "final_check".
7. Finally, it ends at "_end_".
The "check_visualizations" node is associated with the following Python code snippet:
```python
def check_visualizations(state):
""" Node to check the visualizations """
message = state["message"]
answer_template = """Check the description of the visualizations of the video script. {message}"""
answer_instructions = answer_template.format(message=message)
llm = OpenAI(model="gpt-4o", temperature=0)
answer = llm.invoke([SystemMessage(content=answer_instructions) + HumanMessage(content=f"Check the {message}")])
```
The right panel displays the following narration:
* **TURN 5**
* **Narrator (Voiceover):** "Welcome to the future of healthcare data analysis with ThreadStates."
* "[Cut to animated graphics of the Glyph Matrix and Sankey diagrams transforming complex data into clear visuals.]"
* **Narrator (Voiceover):** "ThreadStates revolutionizes how we understand disease progression by turning intricate patient data into insightful stories."
* "[Cut to a healthcare professional analyzing data on a tablet, nodding in understanding.]"
* **OUTPUT**
### Key Observations
The flowchart clearly outlines a sequential process for video script creation and quality control, specifically focusing on the visualization aspect. The Python code snippet suggests the use of OpenAI's GPT-4o model to evaluate the descriptions of the visualizations. The narration highlights the application of ThreadStates in healthcare data analysis.
### Interpretation
The diagram illustrates a workflow designed to ensure the quality and relevance of visualizations within a video script. The integration of an LLM (GPT-4o) suggests an automated approach to evaluating whether the visualizations effectively communicate the intended message. The narration emphasizes the value proposition of ThreadStates – transforming complex healthcare data into understandable insights. The flowchart and narration are likely components of a larger system for automated video content generation or quality assurance. The use of "TURN 5" suggests this is part of a larger sequence of script iterations or revisions. The "Input" node implies that the process is triggered by some external input, likely a draft script or a request for visualization review.