## Screenshot: Technical Workflow Interface
### Overview
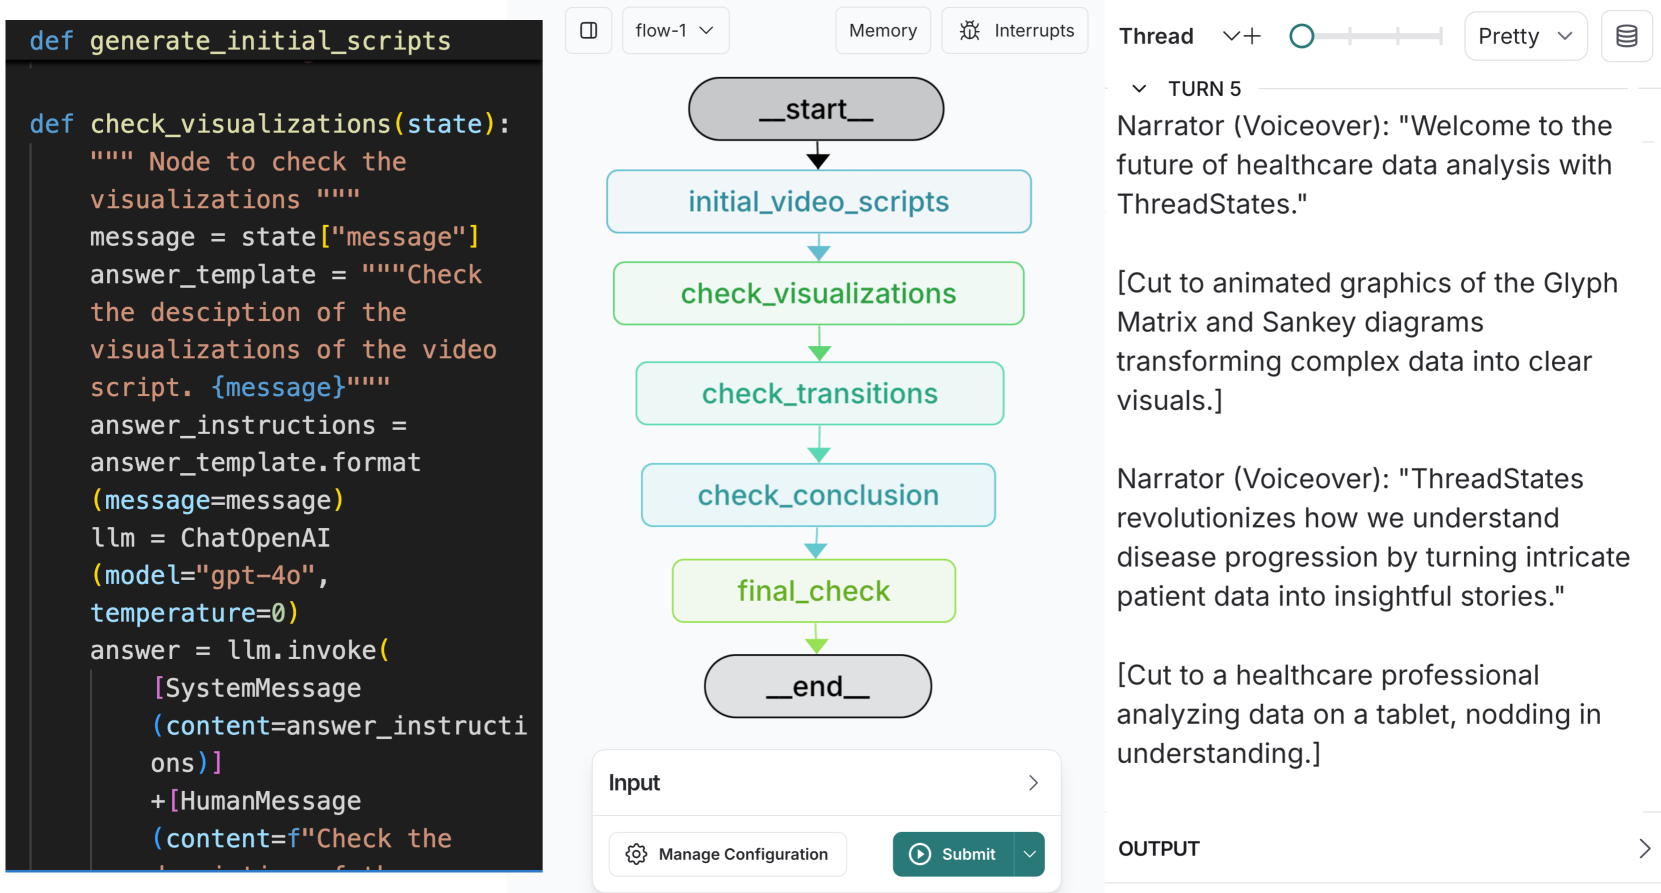
The image displays a technical interface divided into three vertical sections:
1. **Left**: Python code snippets
2. **Center**: Flowchart visualization
3. **Right**: Narrative text with voiceover transcript
---
### Components/Axes
#### Left Section (Code)
- **Functions**:
- `def generate_initial_scripts()`
- `def check_visualizations(state):`
- **Variables**:
- `message = state["message"]`
- `answer_template = """Check the description..."""`
- `answer_instructions = answer_template.format(message=message)`
- `llm = ChatOpenAI(model="gpt-4o", temperature=0)`
- `answer = llm.invoke([SystemMessage(content=answer_instructions), HumanMessage(content="Check the description...")])`
#### Center Section (Flowchart)
- **Nodes**:
- `_start_` (gray oval)
- `initial_video_scripts` (blue rectangle)
- `check_visualizations` (green rectangle)
- `check_transitions` (light green rectangle)
- `check_conclusion` (light blue rectangle)
- `final_check` (green rectangle)
- `_end_` (gray oval)
- **Flow**:
- `_start_` → `initial_video_scripts` → `check_visualizations` → `check_transitions` → `check_conclusion` → `final_check` → `_end_`
- **Colors**:
- Gray: Start/End nodes
- Blue: Initial scripts
- Green: Visualization checks
- Light Green: Transitions
- Light Blue: Conclusion
#### Right Section (Text)
- **Narrator Voiceover**:
- "Welcome to the future of healthcare data analysis with ThreadStates."
- "ThreadStates revolutionizes how we understand disease progression by turning intricate patient data into insightful stories."
- **Visual Examples**:
- Glyph Matrix and Sankey diagrams
- Healthcare professional analyzing data on a tablet
---
### Detailed Analysis
#### Left Section (Code)
- **Key Parameters**:
- `model="gpt-4o"` (OpenAI's GPT-4o model)
- `temperature=0` (deterministic output)
- **Process**:
1. Extracts `message` from `state`
2. Formats `answer_template` with the message
3. Invokes LLM with system/human messages
#### Center Section (Flowchart)
- **Color Coding**:
- Green nodes (`check_visualizations`, `final_check`) indicate validation steps
- Light blue node (`check_conclusion`) represents final synthesis
- **Flow Logic**:
- Sequential progression from script generation to final validation
#### Right Section (Text)
- **Key Phrases**:
- "transforming complex data into clear visuals"
- "nodding in understanding" (emphasizing user comprehension)
---
### Key Observations
1. **Code-UI Integration**: The Python code directly informs the flowchart's logic (e.g., `check_visualizations` corresponds to the green node).
2. **Healthcare Focus**: The narrative emphasizes ThreadStates' role in simplifying medical data analysis.
3. **Visual Hierarchy**: Green nodes dominate the flowchart, suggesting validation is a critical phase.
---
### Interpretation
This interface demonstrates a **healthcare data analysis pipeline** where:
- **AI-generated scripts** (`generate_initial_scripts`) are validated through iterative checks (`check_visualizations`, `check_transitions`).
- The **flowchart** mirrors the code's logic, using color to denote process stages (e.g., green for validation).
- The **narrative** positions ThreadStates as a tool that bridges raw data (Glyph Matrix/Sankey diagrams) to actionable insights for healthcare professionals.
**Notable Pattern**: The use of `temperature=0` in the LLM call ensures consistent, reproducible outputs, critical for medical data analysis where accuracy is paramount.
**Uncertainty**: The exact purpose of `answer_instructions` remains unclear without additional context, but it likely guides the LLM's response formatting.