\n
## Scatter Plot: Confidence vs. Target Length (college_biology)
### Overview
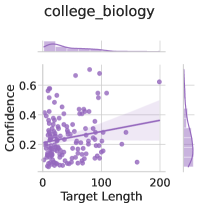
The image presents a scatter plot visualizing the relationship between "Target Length" and "Confidence" for data labeled "college_biology". The plot includes a regression line with a shaded confidence interval, and marginal distributions (histograms) along the top and right edges.
### Components/Axes
* **Title:** college\_biology (top-center)
* **X-axis:** Target Length (bottom-center), ranging from approximately 0 to 220.
* **Y-axis:** Confidence (left-center), ranging from approximately 0.15 to 0.65.
* **Regression Line:** A purple line representing the trend in the data.
* **Confidence Interval:** A light purple shaded area around the regression line.
* **Scatter Points:** Numerous purple dots representing individual data points.
* **Marginal Distribution (Top):** A histogram-like plot showing the distribution of "Target Length".
* **Marginal Distribution (Right):** A histogram-like plot showing the distribution of "Confidence".
### Detailed Analysis
The scatter plot shows a weak positive correlation between "Target Length" and "Confidence". As "Target Length" increases, "Confidence" tends to increase slightly, but the relationship is not strong.
* **Regression Line Trend:** The regression line slopes upward, indicating a positive correlation, but the slope is very shallow.
* **Data Point Distribution:** The data points are clustered relatively tightly around the lower end of the "Target Length" axis (0-100), with a wider spread at higher "Target Length" values.
* **Confidence Interval:** The confidence interval is relatively wide, indicating a high degree of uncertainty in the estimated relationship.
* **Marginal Distribution (Target Length):** The distribution of "Target Length" is skewed to the right, with a peak around 0-50 and a tail extending to approximately 220.
* **Marginal Distribution (Confidence):** The distribution of "Confidence" is roughly bell-shaped, with a peak around 0.25-0.35.
Approximate Data Points (sampled for illustration):
* Target Length = 0, Confidence ≈ 0.25
* Target Length = 50, Confidence ≈ 0.30
* Target Length = 100, Confidence ≈ 0.35
* Target Length = 150, Confidence ≈ 0.40
* Target Length = 200, Confidence ≈ 0.55
### Key Observations
* The relationship between "Target Length" and "Confidence" is weak.
* There is considerable variability in "Confidence" for a given "Target Length".
* The marginal distributions suggest that "Target Length" is more spread out than "Confidence".
* There is an outlier data point at approximately Target Length = 200, Confidence = 0.6.
### Interpretation
The data suggests that "Target Length" is not a strong predictor of "Confidence" in the context of "college\_biology". While there is a slight tendency for "Confidence" to increase with "Target Length", the effect is small and there is a lot of noise in the data. The wide confidence interval around the regression line indicates that the estimated relationship is not very precise. The marginal distributions provide additional information about the distribution of each variable independently. The outlier data point may represent an unusual case or an error in the data.
The plot could be representing the confidence scores of a model predicting biological sequences of varying lengths. The weak correlation suggests that sequence length is not a primary factor in the model's confidence. Further investigation would be needed to determine the factors that do influence confidence.