TECHNICAL ASSET FINGERPRINT
cc4dd6ece35ab8348c2dfb8d
Click to view fullscreen
Press ESC or click to close
FOUND IN PAPERS
EXPERT: gemini-2.5-flash-free VERSION 1
RUNTIME: google-free/gemini-2.5-flash
INTEL_VERIFIED
## Chart Type: Scatter Plot with Fitted Curve
### Overview
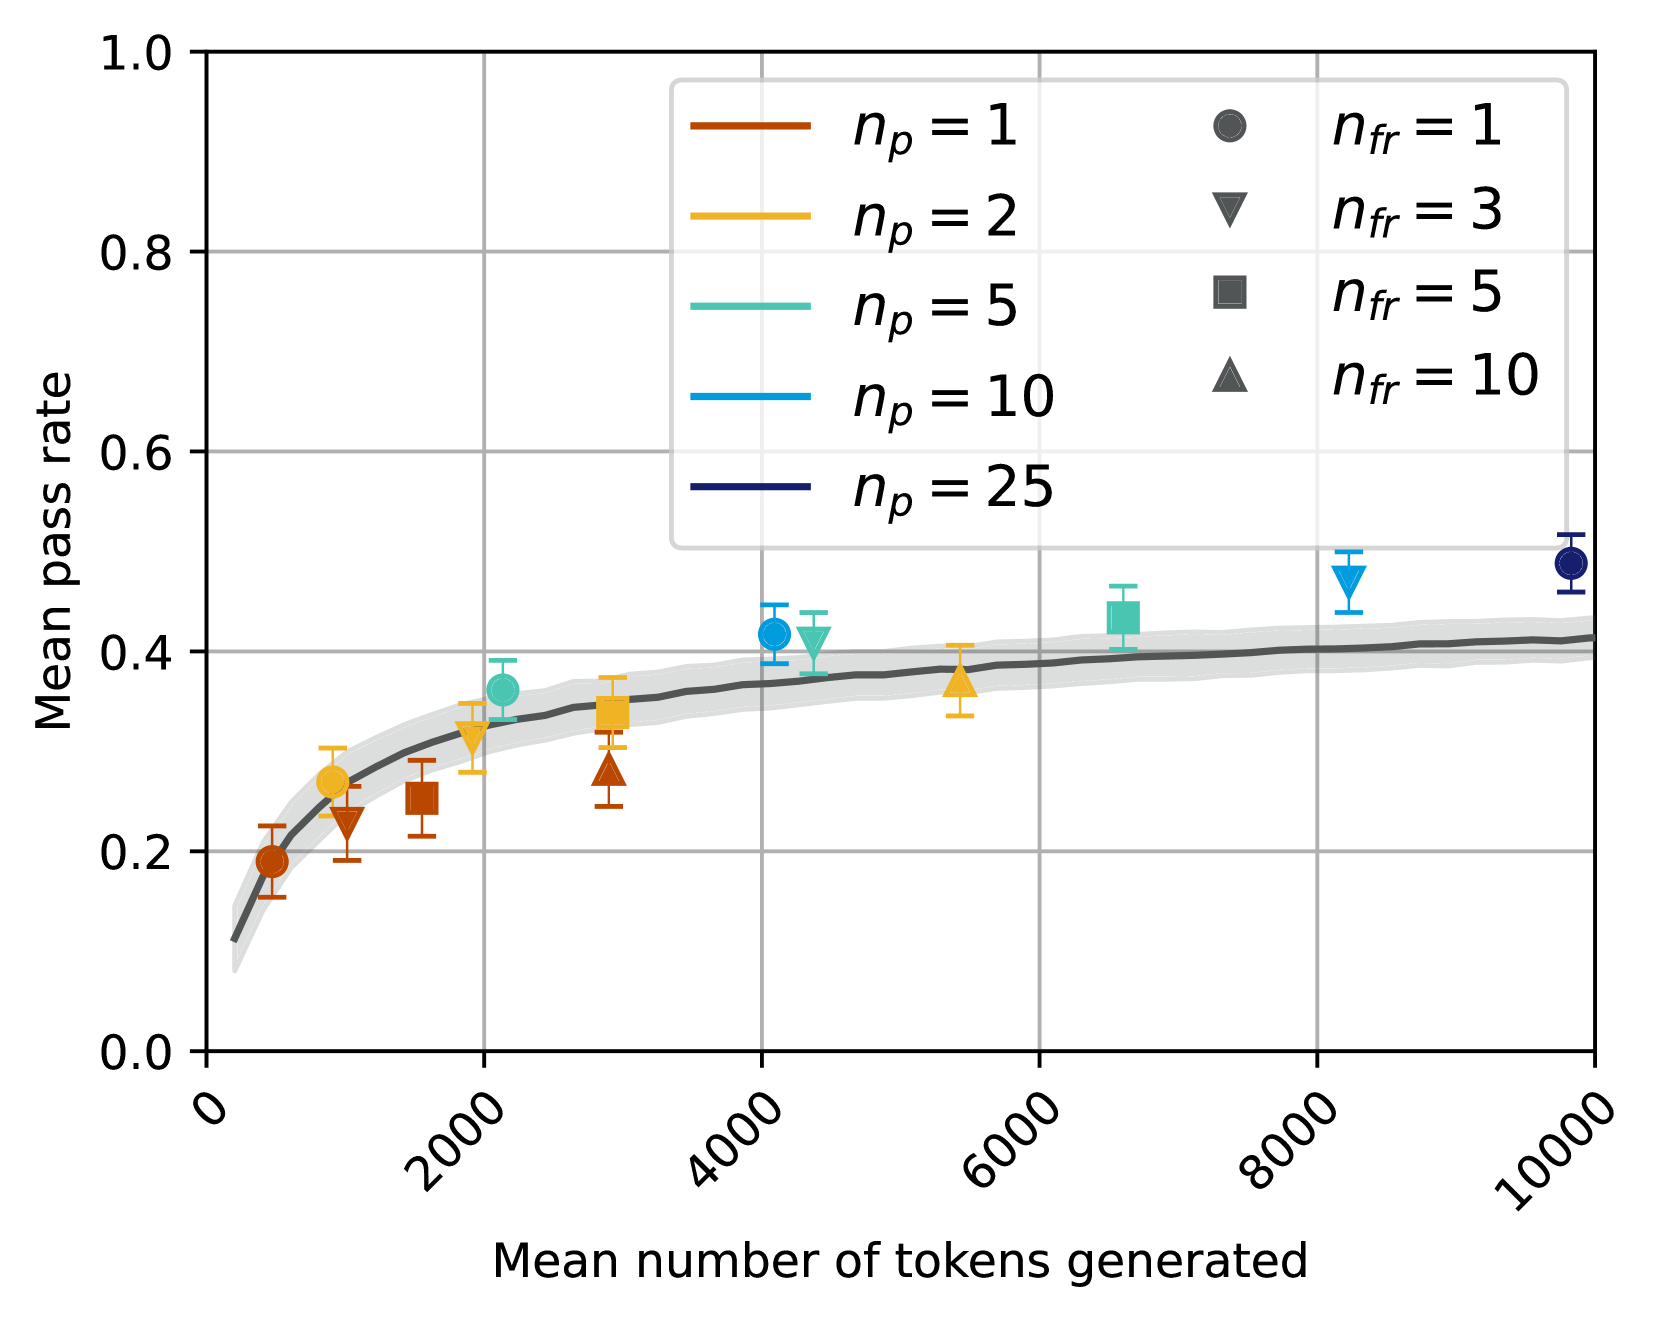
This image displays a scatter plot illustrating the relationship between "Mean number of tokens generated" on the x-axis and "Mean pass rate" on the y-axis. The data points are categorized by two parameters, `n_p` (represented by color) and `n_fr` (represented by marker shape), and each point includes vertical error bars. A dark grey fitted curve with a lighter grey confidence interval band shows the overall trend.
### Components/Axes
**X-axis:**
* **Title:** "Mean number of tokens generated"
* **Range:** Approximately 0 to 10000
* **Major Tick Marks:** 0, 2000, 4000, 6000, 8000, 10000. The labels are rotated counter-clockwise.
**Y-axis:**
* **Title:** "Mean pass rate"
* **Range:** 0.0 to 1.0
* **Major Tick Marks:** 0.0, 0.2, 0.4, 0.6, 0.8, 1.0
**Legend (located in the top-right quadrant):**
The legend is divided into two columns, indicating the mapping of `n_p` to line colors and `n_fr` to marker shapes.
* **Left Column (Line colors for `n_p`):**
* Brown line: `n_p = 1`
* Gold/Yellow line: `n_p = 2`
* Teal/Cyan line: `n_p = 5`
* Light Blue line: `n_p = 10`
* Dark Blue/Navy line: `n_p = 25`
* **Right Column (Marker shapes for `n_fr`):**
* Dark Grey circle: `n_fr = 1`
* Dark Grey downward triangle: `n_fr = 3`
* Dark Grey square: `n_fr = 5`
* Dark Grey upward triangle: `n_fr = 10`
**Fitted Curve:**
A dark grey line represents the overall trend of the data. It starts near (0, 0.1) and increases, then gradually flattens out. A lighter grey shaded area surrounds this line, indicating a confidence interval or standard deviation for the fitted trend.
### Detailed Analysis
**Overall Trend (Fitted Curve):**
The dark grey fitted curve shows a positive, non-linear relationship. The "Mean pass rate" increases rapidly from approximately 0.1 at 0 tokens to about 0.38 at 3000 tokens. After this point, the rate of increase slows significantly, with the curve leveling off to approximately 0.42 at 10000 tokens. The grey shaded area around the curve indicates a relatively narrow confidence interval, suggesting the trend is well-defined.
**Individual Data Points (grouped by `n_p` and ordered by increasing "Mean number of tokens generated"):**
Each data point is represented by a colored marker with vertical error bars. The color corresponds to `n_p` and the marker shape to `n_fr`. The error bars typically span approximately +/- 0.01 to 0.02 in "Mean pass rate".
* **`n_p = 1` (Brown points):**
* `n_fr = 1` (circle): X ~ 700, Y ~ 0.19 (Error range: ~0.17 - 0.21)
* `n_fr = 3` (downward triangle): X ~ 1100, Y ~ 0.22 (Error range: ~0.20 - 0.24)
* `n_fr = 5` (square): X ~ 1700, Y ~ 0.25 (Error range: ~0.23 - 0.27)
* `n_fr = 10` (upward triangle): X ~ 2800, Y ~ 0.28 (Error range: ~0.26 - 0.30)
* *Trend for `n_p=1`*: The pass rate increases from 0.19 to 0.28 as tokens generated increase from ~700 to ~2800.
* **`n_p = 2` (Gold/Yellow points):**
* `n_fr = 1` (circle): X ~ 900, Y ~ 0.24 (Error range: ~0.22 - 0.26)
* `n_fr = 3` (downward triangle): X ~ 1600, Y ~ 0.28 (Error range: ~0.26 - 0.30)
* `n_fr = 5` (square): X ~ 2600, Y ~ 0.33 (Error range: ~0.31 - 0.35)
* `n_fr = 10` (upward triangle): X ~ 4200, Y ~ 0.37 (Error range: ~0.35 - 0.39)
* *Trend for `n_p=2`*: The pass rate increases from 0.24 to 0.37 as tokens generated increase from ~900 to ~4200.
* **`n_p = 5` (Teal/Cyan points):**
* `n_fr = 1` (circle): X ~ 1800, Y ~ 0.35 (Error range: ~0.33 - 0.37)
* `n_fr = 3` (downward triangle): X ~ 3800, Y ~ 0.38 (Error range: ~0.36 - 0.40)
* `n_fr = 5` (square): X ~ 5200, Y ~ 0.40 (Error range: ~0.38 - 0.42)
* `n_fr = 10` (upward triangle): X ~ 7000, Y ~ 0.42 (Error range: ~0.40 - 0.44)
* *Trend for `n_p=5`*: The pass rate increases from 0.35 to 0.42 as tokens generated increase from ~1800 to ~7000, showing a slower rate of increase at higher token counts.
* **`n_p = 10` (Light Blue points):**
* `n_fr = 1` (circle): X ~ 4100, Y ~ 0.42 (Error range: ~0.40 - 0.44)
* `n_fr = 3` (downward triangle): X ~ 5400, Y ~ 0.43 (Error range: ~0.41 - 0.45)
* `n_fr = 5` (square): X ~ 7800, Y ~ 0.47 (Error range: ~0.45 - 0.49)
* *Note*: No data point for `n_fr = 10` is visible for `n_p = 10`.
* *Trend for `n_p=10`*: The pass rate increases from 0.42 to 0.47 as tokens generated increase from ~4100 to ~7800.
* **`n_p = 25` (Dark Blue/Navy points):**
* `n_fr = 1` (circle): X ~ 5500, Y ~ 0.40 (Error range: ~0.38 - 0.42)
* `n_fr = 3` (downward triangle): X ~ 8200, Y ~ 0.48 (Error range: ~0.46 - 0.50)
* `n_fr = 5` (square): X ~ 9800, Y ~ 0.49 (Error range: ~0.47 - 0.51)
* `n_fr = 10` (upward triangle): X ~ 9900, Y ~ 0.49 (Error range: ~0.47 - 0.51)
* *Trend for `n_p=25`*: The pass rate increases from 0.40 to 0.49 as tokens generated increase from ~5500 to ~9900, reaching the highest observed pass rates.
### Key Observations
* **Universal Positive Correlation:** All data series demonstrate a positive correlation between "Mean number of tokens generated" and "Mean pass rate."
* **Diminishing Returns:** The overall fitted curve clearly shows diminishing returns; the pass rate increases sharply at lower token counts but then plateaus, suggesting that beyond a certain number of tokens (around 4000-5000), further generation yields only marginal improvements in pass rate.
* **Influence of `n_p`:** Higher values of `n_p` (e.g., `n_p=10`, `n_p=25`) are generally associated with higher "Mean pass rates" and higher "Mean number of tokens generated" compared to lower `n_p` values (e.g., `n_p=1`, `n_p=2`). This suggests `n_p` might be a parameter that enables access to higher performance ceilings.
* **Influence of `n_fr`:** For a given `n_p`, increasing `n_fr` (from 1 to 10) consistently corresponds to an increase in "Mean number of tokens generated" and, consequently, an increase in "Mean pass rate." This indicates `n_fr` is a factor that drives the extent of token generation.
* **Clustering by `n_p`:** Data points for lower `n_p` values (`n_p=1`, `n_p=2`) are clustered towards the lower-left of the chart (fewer tokens, lower pass rates), while higher `n_p` values (`n_p=10`, `n_p=25`) are clustered towards the upper-right (more tokens, higher pass rates).
* **Missing Data Point:** The absence of an `n_fr=10` data point for `n_p=10` is a notable gap in the observed data.
### Interpretation
This chart suggests that both `n_p` and `n_fr` are critical parameters influencing the performance, measured by "Mean pass rate," in a system that generates tokens.
The "Mean number of tokens generated" acts as a proxy for the effort or complexity of the generation process. The overall trend indicates that more effort (more tokens) generally leads to better results (higher pass rate), but this improvement is not linear and eventually saturates. This implies there's an optimal range for token generation where the benefits outweigh the computational cost.
The parameter `n_p` appears to control the *potential* or *capacity* of the system. Higher `n_p` values allow the system to achieve higher pass rates, especially when a sufficient number of tokens are generated. This could mean `n_p` relates to the breadth of search, the diversity of generated candidates, or the inherent quality of the generation process.
The parameter `n_fr` seems to directly influence the *extent* of token generation. For a fixed `n_p`, increasing `n_fr` pushes the system to generate more tokens, moving it along the x-axis and, consequently, up the y-axis towards higher pass rates, following the diminishing returns curve. This might represent the number of iterations, fragments, or attempts made during the generation process.
In practical terms, to achieve a high "Mean pass rate," one would likely need to select a sufficiently high `n_p` value and then tune `n_fr` to generate enough tokens to reach the plateau of the pass rate curve. For instance, `n_p=25` with `n_fr=5` or `n_fr=10` yields the highest observed pass rates (around 0.49) at the cost of generating nearly 10,000 tokens. However, `n_p=10` with `n_fr=5` achieves a pass rate of 0.47 with approximately 7,800 tokens, which might be a more efficient trade-off depending on the cost of token generation. The missing `n_fr=10` point for `n_p=10` could be an area for further investigation to understand if
DECODING INTELLIGENCE...