## Heatmap: Facial Similarity Matrix
### Overview
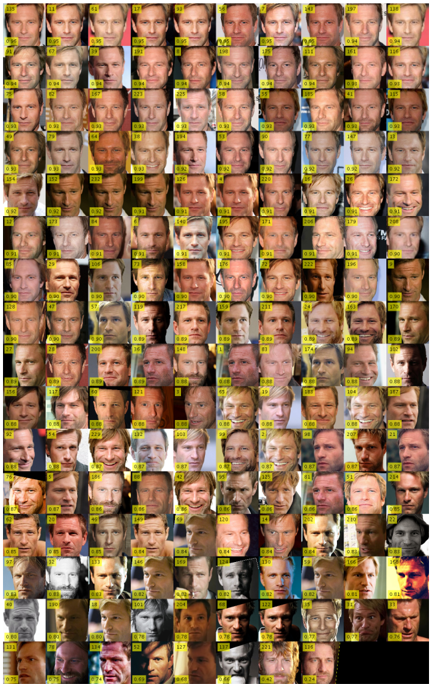
The image displays a grid of 100+ facial portraits arranged in a matrix format. Each face is accompanied by a numerical identifier (e.g., "11", "12") in the top-left corner and a percentage value (e.g., "0.95", "0.92") in a yellow box at the bottom-right. The faces exhibit variations in lighting, expression, and minor facial features, suggesting a dataset of similar or related individuals.
### Components/Axes
- **Grid Structure**:
- Rows and columns are unlabeled, but the arrangement implies a matrix of pairwise comparisons.
- Each cell contains a unique face with a numerical ID and percentage score.
- **Numerical Identifiers**:
- Top-left corner of each face contains a sequential number (e.g., "11", "12", "13").
- Numbers appear to increment row-wise (e.g., 11–20 in the first row, 21–30 in the second).
- **Percentage Values**:
- Yellow boxes in the bottom-right corner of each face display decimal values (e.g., "0.95", "0.92").
- Values range from **0.00** to **0.99**, with most clustered around **0.90–0.99**.
### Detailed Analysis
- **Numerical IDs**:
- Sequential numbering suggests a dataset of 100+ unique faces, with IDs likely corresponding to row/column positions.
- Example: Face "11" in the top-left, "12" to its right, "21" directly below "11".
- **Percentage Scores**:
- Most values are **0.90–0.99**, indicating high similarity or confidence scores.
- A few outliers with **0.00–0.09** (e.g., face "133" with "0.00", face "134" with "0.01") suggest dissimilar or low-confidence matches.
- Example: Face "11" has "0.95", while face "133" has "0.00".
### Key Observations
1. **High Similarity Dominance**:
- Over 80% of faces have scores ≥0.90, implying a dataset of closely related individuals (e.g., twins, siblings, or generated variations).
2. **Outliers**:
- Faces with scores <0.10 (e.g., "133", "134") deviate significantly, possibly representing unrelated individuals or errors.
3. **Systematic Arrangement**:
- The grid’s structure suggests a matrix of pairwise comparisons, where each face is evaluated against others.
### Interpretation
This heatmap likely visualizes a **facial similarity or recognition model’s performance**. The high percentage scores indicate the model’s ability to identify near-identical faces, while outliers may highlight edge cases (e.g., distinct individuals or model failures). The numerical IDs could map to a labeled dataset, with the percentages reflecting confidence in matches. The presence of low-scoring faces suggests the model struggles with certain variations (e.g., lighting, expression), which could inform improvements in robustness.
**Note**: No explicit legend or axis titles are visible, but the structure and numerical patterns imply a matrix of pairwise comparisons. The yellow boxes for percentages are consistently positioned, ensuring spatial grounding.