\n
## Diagram: Tiling and Parallelization Scheme for Convolutional Neural Networks
### Overview
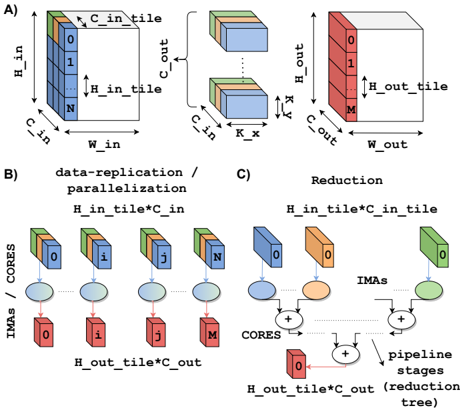
The image presents a diagram illustrating a tiling and parallelization scheme for convolutional neural networks (CNNs). It depicts how input data is divided into tiles, processed in parallel, and then reduced to produce the output. The diagram is divided into three sections: A) Tiling, B) Data Replication/Parallelization, and C) Reduction.
### Components/Axes
The diagram uses several labels to describe the dimensions and processes involved:
* **A) Tiling:**
* `H_in`: Input Height
* `W_in`: Input Width
* `C_in`: Input Channels
* `H_out`: Output Height
* `W_out`: Output Width
* `C_out`: Output Channels
* `H_in_tile`: Height of input tile
* `H_out_tile`: Height of output tile
* `K`: Kernel size (indicated by the double-headed arrow)
* Numbers 0 through N and 0 through M are used to label tiles within the input and output volumes, respectively.
* **B) Data Replication / Parallelization:**
* `IMAs / CORES`: Indicates the mapping of input tiles to processing cores.
* `H_in_tile * C_in`: Dimensions of the input tile.
* `H_out_tile * C_out`: Dimensions of the output tile.
* Labels i, j, and M are used to identify specific tiles and their corresponding cores.
* **C) Reduction:**
* `IMAs`: Intermediate results.
* `CORES`: Processing cores.
* `pipeline stages (tree)`: Indicates a tree-like structure for the reduction process.
* `H_in_tile * C_in_tile`: Dimensions of the input tile.
* `H_out_tile * C_out`: Dimensions of the output tile.
* Plus signs (+) indicate summation operations.
### Detailed Analysis or Content Details
**A) Tiling:**
This section shows the division of an input volume into tiles. The input volume has dimensions `H_in`, `W_in`, and `C_in`. It is divided into tiles of size `H_in_tile` along the height and `W_in` along the width. The number of tiles along the height is represented by `N`. The output volume has dimensions `H_out`, `W_out`, and `C_out`. It is divided into tiles of size `H_out_tile` along the height and `W_out` along the width. The number of tiles along the height is represented by `M`. A kernel of size `K` is used for the convolution operation.
**B) Data Replication / Parallelization:**
This section illustrates how the input tiles are replicated and distributed to multiple cores for parallel processing. Each core processes one input tile and produces one output tile. The input tiles are labeled 0 through N, and the output tiles are labeled 0 through M. The mapping between input tiles and cores is indicated by the lines connecting the tiles to the cores.
**C) Reduction:**
This section shows the reduction process, where the intermediate results from the cores are combined to produce the final output. The intermediate results are represented by the `IMAs`. The cores perform summation operations to combine the intermediate results. The reduction process is organized in a tree-like structure, with multiple pipeline stages.
### Key Observations
* The tiling scheme divides the input and output volumes into smaller tiles to facilitate parallel processing.
* The data replication/parallelization scheme distributes the input tiles to multiple cores for parallel processing.
* The reduction scheme combines the intermediate results from the cores to produce the final output.
* The pipeline stages in the reduction scheme suggest a multi-stage processing pipeline.
### Interpretation
The diagram demonstrates a strategy for accelerating convolutional neural network computations through tiling and parallelization. By dividing the input data into smaller tiles, the computation can be distributed across multiple processing cores, significantly reducing the overall processing time. The reduction stage efficiently combines the results from these cores to produce the final output. The tree-like structure of the reduction stage suggests a hierarchical approach to combining the intermediate results, potentially optimizing communication and synchronization between cores. This approach is particularly relevant for large-scale CNNs where computational demands are high. The use of "IMAs" suggests intermediate activation maps. The diagram highlights a common technique used in hardware acceleration of deep learning models, where the workload is partitioned and distributed to maximize throughput.