## Line Chart: Model Accuracy on Math Problems
### Overview
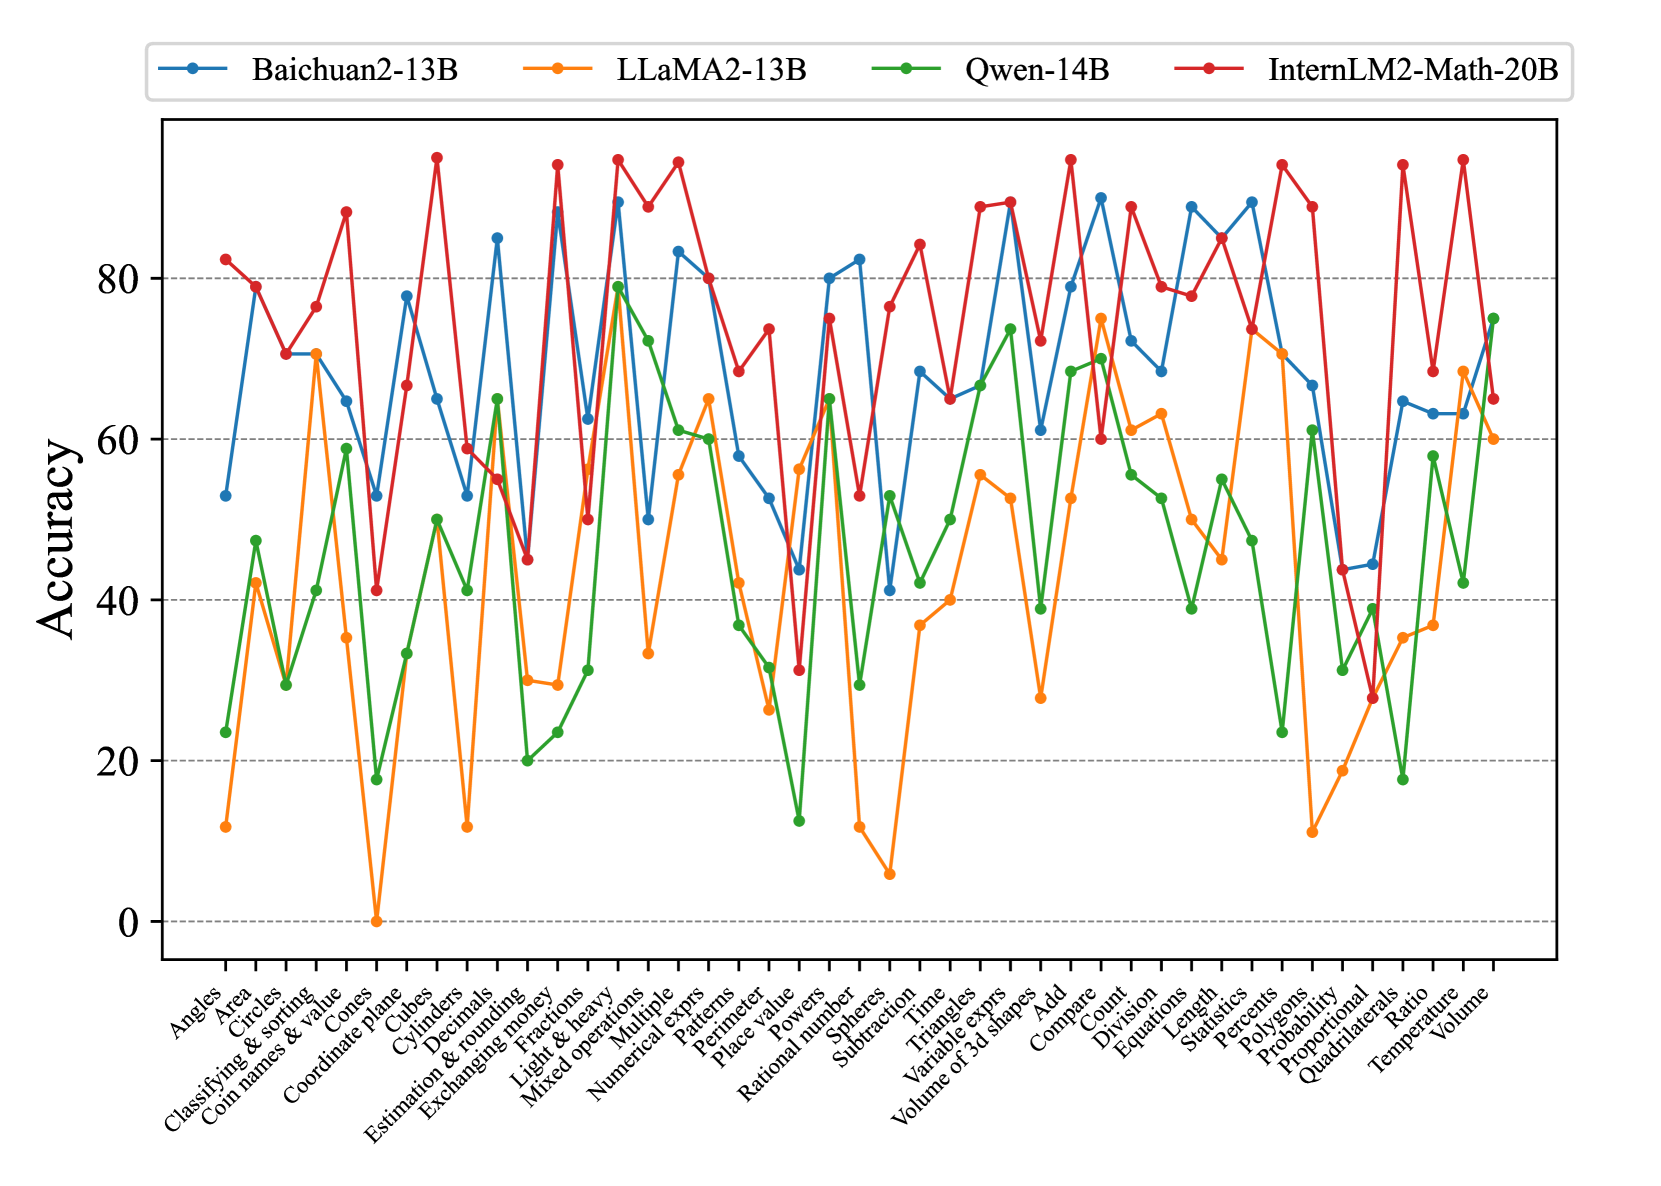
The image is a line chart comparing the accuracy of four different language models (Baichuan2-13B, LLaMA2-13B, Qwen-14B, and InternLM2-Math-20B) on a variety of math problem types. The x-axis represents different math problem categories, and the y-axis represents the accuracy score.
### Components/Axes
* **Title:** None explicitly present in the image.
* **X-axis:**
* Label: Math problem categories.
* Categories (from left to right): Angles, Area, Circles, Classifying & sorting, Coin names & value, Cones, Coordinate plane, Cubes, Cylinders, Decimals, Estimation & rounding, Exchanging money, Fractions, Light & heavy, Mixed operations, Multiple, Numerical exprs, Patterns, Perimeter, Place value, Powers, Rational number, Spheres, Subtraction, Time, Triangles, Variable exprs, Volume of 3d shapes, Add, Compare, Count, Division, Equations, Length, Percents, Polygons, Probability, Proportional, Quadrilaterals, Ratio, Statistics, Temperature, Volume.
* **Y-axis:**
* Label: Accuracy
* Scale: 0 to 80, with tick marks at intervals of 20.
* **Legend:** Located at the top of the chart.
* Baichuan2-13B (Blue)
* LLaMA2-13B (Orange)
* Qwen-14B (Green)
* InternLM2-Math-20B (Red)
* Gridlines: Horizontal dashed lines at intervals of 20 on the y-axis.
### Detailed Analysis
Here's a breakdown of each model's performance across the different math problem categories:
* **Baichuan2-13B (Blue):**
* Trend: Highly variable performance across categories. Starts around 60% accuracy for "Angles," drops sharply for "Area," then fluctuates significantly.
* Key Data Points:
* Angles: ~53%
* Area: ~10%
* Circles: ~40%
* Coordinate plane: ~82%
* Fractions: ~30%
* Powers: ~65%
* Time: ~45%
* Add: ~75%
* Volume: ~70%
* **LLaMA2-13B (Orange):**
* Trend: Generally lower accuracy compared to other models. Exhibits significant drops in performance for specific categories.
* Key Data Points:
* Angles: ~12%
* Area: ~42%
* Circles: ~2%
* Coordinate plane: ~70%
* Fractions: ~30%
* Powers: ~58%
* Time: ~38%
* Add: ~40%
* Volume: ~65%
* **Qwen-14B (Green):**
* Trend: More consistent performance than LLaMA2-13B, but still variable. Generally lower than Baichuan2-13B and InternLM2-Math-20B.
* Key Data Points:
* Angles: ~23%
* Area: ~45%
* Circles: ~28%
* Coordinate plane: ~65%
* Fractions: ~22%
* Powers: ~55%
* Time: ~60%
* Add: ~65%
* Volume: ~75%
* **InternLM2-Math-20B (Red):**
* Trend: Generally the highest accuracy among the four models. Shows strong performance across most categories, but still has some variability.
* Key Data Points:
* Angles: ~80%
* Area: ~70%
* Circles: ~80%
* Coordinate plane: ~90%
* Fractions: ~75%
* Powers: ~70%
* Time: ~80%
* Add: ~85%
* Volume: ~68%
### Key Observations
* InternLM2-Math-20B consistently outperforms the other models across most math problem categories.
* LLaMA2-13B generally has the lowest accuracy.
* All models exhibit variability in performance depending on the specific math problem category.
* There are significant performance differences between models on categories like "Area", "Circles", and "Angles".
### Interpretation
The data suggests that InternLM2-Math-20B is the most proficient at solving a wide range of math problems among the models tested. The variability in performance across different categories highlights the strengths and weaknesses of each model in specific areas of mathematical reasoning. The relatively poor performance of LLaMA2-13B suggests it may require further training or fine-tuning to achieve comparable accuracy to the other models. The chart demonstrates the importance of evaluating language models on diverse datasets to understand their capabilities and limitations.