\n
## Violin Plot: High School CS Accuracy
### Overview
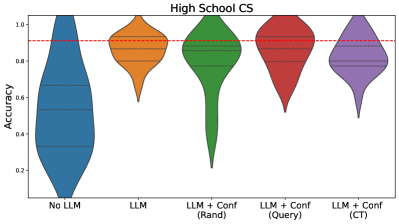
The image presents a violin plot comparing the accuracy scores for different approaches to a High School Computer Science (CS) task. The approaches are: "No LLM", "LLM", "LLM + Conf (Rand)", "LLM + Conf (Query)", and "LLM + Conf (CT)". The plot visualizes the distribution of accuracy scores for each approach. A horizontal dashed red line is present across the plot, likely representing a benchmark or threshold.
### Components/Axes
* **X-axis:** Categorical, representing the different approaches: "No LLM", "LLM", "LLM + Conf (Rand)", "LLM + Conf (Query)", "LLM + Conf (CT)".
* **Y-axis:** Numerical, labeled "Accuracy", with a scale ranging from approximately 0.2 to 1.0.
* **Violin Plots:** Each approach has a corresponding violin plot showing the distribution of accuracy scores. The width of each violin represents the density of scores at that accuracy level.
* **Horizontal Dashed Line:** A red dashed horizontal line is present at approximately y = 0.85.
### Detailed Analysis
The violin plots show the following distributions:
1. **No LLM (Blue):** The distribution is centered around approximately 0.6, with a range from roughly 0.2 to 1.0. The plot is relatively wide, indicating a significant spread in accuracy scores.
2. **LLM (Orange):** The distribution is centered around approximately 0.7, with a range from roughly 0.4 to 0.9. The plot is narrower than "No LLM", suggesting less variability.
3. **LLM + Conf (Rand) (Green):** The distribution is centered around approximately 0.9, with a range from roughly 0.6 to 1.0. This plot is the tallest, indicating a higher concentration of scores near 1.0.
4. **LLM + Conf (Query) (Red):** The distribution is centered around approximately 0.8, with a range from roughly 0.5 to 1.0. The plot is moderately wide.
5. **LLM + Conf (CT) (Purple):** The distribution is centered around approximately 0.85, with a range from roughly 0.6 to 1.0. The plot is similar in shape to "LLM + Conf (Query)".
The red dashed line at approximately 0.85 appears to be a threshold. The "LLM + Conf (Rand)" and "LLM + Conf (CT)" approaches have distributions that largely exceed this threshold.
### Key Observations
* The "No LLM" approach has the lowest average accuracy and the widest distribution.
* Adding an LLM improves accuracy compared to "No LLM".
* The "LLM + Conf (Rand)" approach demonstrates the highest accuracy, with a significant portion of scores near 1.0.
* The "LLM + Conf (Query)" and "LLM + Conf (CT)" approaches show similar performance, with average accuracy around 0.8.
* The red dashed line serves as a performance benchmark, and the "LLM + Conf (Rand)" approach consistently surpasses it.
### Interpretation
The data suggests that incorporating Large Language Models (LLMs) improves accuracy on the High School CS task. Furthermore, combining LLMs with confidence-based methods ("LLM + Conf") leads to even greater accuracy gains. The "LLM + Conf (Rand)" approach, utilizing a random confidence method, appears to be the most effective, consistently achieving high accuracy scores.
The wide distribution of scores for the "No LLM" approach indicates a high degree of variability in performance without the assistance of an LLM. The narrowing of distributions as LLMs and confidence methods are added suggests that these techniques reduce variability and provide more consistent results.
The red dashed line likely represents a desired accuracy threshold. The fact that "LLM + Conf (Rand)" consistently exceeds this threshold highlights its potential for practical application in this context. The other "LLM + Conf" methods also perform well, but not as consistently as the "Rand" approach. This could indicate that the random confidence method is particularly well-suited to the specific characteristics of the High School CS task.