## Radar Charts of Character Profiles
### Overview
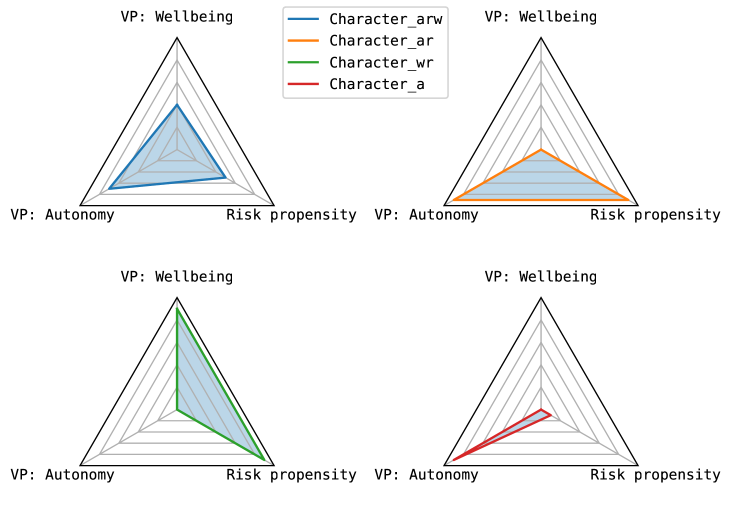
The image displays four triangular radar charts (also known as spider charts or star plots) arranged in a 2x2 grid. Each chart visualizes a different character profile across three common axes. A single legend is positioned at the top center of the entire image, above the charts.
### Components/Axes
* **Chart Type:** Triangular Radar Chart.
* **Axes (Identical for all four charts):**
* **Top Vertex:** "VP: Wellbeing"
* **Bottom-Left Vertex:** "VP: Autonomy"
* **Bottom-Right Vertex:** "Risk propensity"
* **Grid:** Each chart features concentric triangular grid lines radiating from the center, representing incremental scale levels from the center (low) to the outer edge (high).
* **Legend (Top Center):**
* A blue line corresponds to "Character_arw"
* An orange line corresponds to "Character_ar"
* A green line corresponds to "Character_wr"
* A red line corresponds to "Character_a"
* **Spatial Layout:**
* **Top-Left Chart:** Contains the blue line ("Character_arw").
* **Top-Right Chart:** Contains the orange line ("Character_ar").
* **Bottom-Left Chart:** Contains the green line ("Character_wr").
* **Bottom-Right Chart:** Contains the red line ("Character_a").
### Detailed Analysis
Each chart is analyzed independently. Values are approximate, estimated from the grid lines where the outermost triangle represents the maximum (100%) and the center represents the minimum (0%).
**1. Top-Left Chart: Character_arw (Blue Line)**
* **Visual Trend:** The blue line forms a relatively balanced, equilateral triangle, indicating moderate to high scores across all three axes.
* **Approximate Values:**
* VP: Wellbeing: ~75% (extends about three-quarters of the way to the outer vertex).
* VP: Autonomy: ~70%.
* Risk propensity: ~65%.
**2. Top-Right Chart: Character_ar (Orange Line)**
* **Visual Trend:** The orange line forms a triangle skewed heavily towards the "Risk propensity" axis, with lower scores on the other two.
* **Approximate Values:**
* VP: Wellbeing: ~40%.
* VP: Autonomy: ~35%.
* Risk propensity: ~85% (extends very close to the outer vertex).
**3. Bottom-Left Chart: Character_wr (Green Line)**
* **Visual Trend:** The green line forms a triangle skewed heavily towards the "VP: Wellbeing" axis, with a very low score on "Risk propensity".
* **Approximate Values:**
* VP: Wellbeing: ~90% (extends almost to the outer vertex).
* VP: Autonomy: ~60%.
* Risk propensity: ~10% (very close to the center).
**4. Bottom-Right Chart: Character_a (Red Line)**
* **Visual Trend:** The red line forms a very narrow, elongated triangle pointing strongly towards the "VP: Autonomy" axis, with minimal scores on the other two axes.
* **Approximate Values:**
* VP: Wellbeing: ~15%.
* VP: Autonomy: ~80%.
* Risk propensity: ~5% (extremely close to the center).
### Key Observations
* **Profile Specialization:** Each character profile shows a distinct specialization: `Character_arw` is balanced, `Character_ar` is risk-oriented, `Character_wr` is wellbeing-oriented, and `Character_a` is autonomy-oriented.
* **Inverse Relationships:** There appears to be an inverse relationship between "Risk propensity" and "VP: Wellbeing" when comparing the `Character_ar` (high risk, low wellbeing) and `Character_wr` (low risk, high wellbeing) profiles.
* **Extreme Specialization:** The `Character_a` profile is the most extreme, with a very high score in one dimension (Autonomy) and negligible scores in the other two.
* **Naming Convention:** The suffixes in the character names (`_arw`, `_ar`, `_wr`, `_a`) likely correspond to the axes they emphasize: **a**utonomy, **r**isk, **w**ellbeing.
### Interpretation
This set of charts likely represents a typology or classification system for characters, personas, or agents within a model (e.g., for game design, psychological profiling, or AI behavior modeling). The three axes—Wellbeing, Autonomy, and Risk Propensity—form a foundational "value profile" (VP) triangle.
The data suggests a design space where characters are defined by trade-offs between these three core values. A character cannot maximize all three simultaneously within this model. The profiles demonstrate clear archetypes:
* The **Generalist (`Character_arw`)** maintains moderate levels of all traits.
* The **Risk-Taker (`Character_ar`)** sacrifices wellbeing and autonomy for high risk propensity.
* The **Well-Being Seeker (`Character_wr`)** avoids risk to maximize wellbeing, with moderate autonomy.
* The **Autonomist (`Character_a`)** prioritizes independence above all else, with little regard for wellbeing or risk.
The visualization effectively communicates that these are distinct, non-overlapping profiles. The use of separate charts for each profile, rather than overlaying all lines on one chart, emphasizes their individuality and prevents visual clutter, making the specialized shape of each profile immediately apparent. The naming convention provides a direct mnemonic link between the character's label and its dominant traits.