## Scatter Plot: Training Loss vs. FLOPS for Varying Model Sizes
### Overview
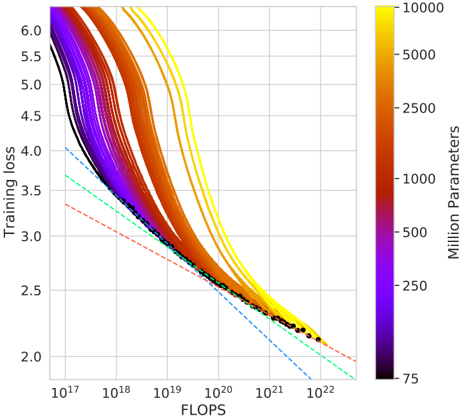
The image is a scatter plot showing the relationship between training loss and FLOPS (floating point operations per second) for various machine learning models. The color of each line represents the number of parameters in the model, ranging from 75 million (purple) to 10,000 million (yellow). The plot also includes dashed lines of different colors, which may represent different scaling laws or theoretical limits.
### Components/Axes
* **X-axis:** FLOPS (Floating Point Operations Per Second) on a logarithmic scale, ranging from approximately 10<sup>17</sup> to 10<sup>22</sup>.
* **Y-axis:** Training loss on a linear scale, ranging from 2.0 to 6.0.
* **Color Bar (Legend):** Located on the right side of the plot, indicating the number of parameters in millions. The color gradient ranges from purple (75 million parameters) to yellow (10,000 million parameters). Intermediate values are marked at 250, 500, 1000, 2500, and 5000 million parameters.
### Detailed Analysis
* **Data Series:** Multiple lines, each representing a different model size (number of parameters). The lines are colored according to the color bar, with purple lines representing smaller models and yellow lines representing larger models.
* **General Trend:** All lines show a decreasing trend, indicating that training loss decreases as FLOPS increase. The rate of decrease appears to diminish as FLOPS increase, suggesting diminishing returns.
* **Model Size Impact:** Models with more parameters (yellow lines) generally achieve lower training loss for a given number of FLOPS, especially at lower FLOPS values.
* **Dashed Lines:** There are three dashed lines:
* A red dashed line, starting at approximately (10<sup>17</sup>, 3.8) and decreasing to approximately (10<sup>22</sup>, 2.1).
* A cyan dashed line, starting at approximately (10<sup>17</sup>, 4.2) and decreasing to approximately (10<sup>22</sup>, 2.2).
* A blue dashed line, starting at approximately (10<sup>17</sup>, 4.0) and decreasing to approximately (10<sup>22</sup>, 1.9).
* **Black Dashed Line with Dots:** A black dashed line with black dots runs along the bottom of the data series, representing the lowest training loss achieved for a given number of FLOPS.
### Key Observations
* **Diminishing Returns:** The decrease in training loss slows down as FLOPS increase, suggesting that there is a limit to how much training loss can be reduced by simply increasing FLOPS.
* **Model Size Matters:** Larger models (more parameters) tend to achieve lower training loss, especially at lower FLOPS values.
* **Convergence:** The lines appear to converge as FLOPS increase, suggesting that the benefit of larger models diminishes as FLOPS increase.
* **Scaling Laws:** The dashed lines may represent different scaling laws or theoretical limits on the relationship between training loss and FLOPS.
### Interpretation
The plot demonstrates the relationship between training loss, FLOPS, and model size. It suggests that increasing FLOPS and model size can both lead to lower training loss, but there are diminishing returns to both. The dashed lines may represent different scaling laws or theoretical limits on the relationship between training loss and FLOPS. The black dashed line with dots represents the optimal training loss achieved for a given number of FLOPS, regardless of model size. The data suggests that there is a trade-off between model size and FLOPS, and that the optimal choice depends on the specific application and available resources.