## Radar Charts: AI Model Performance Across Mathematical Benchmarks and Domains
### Overview
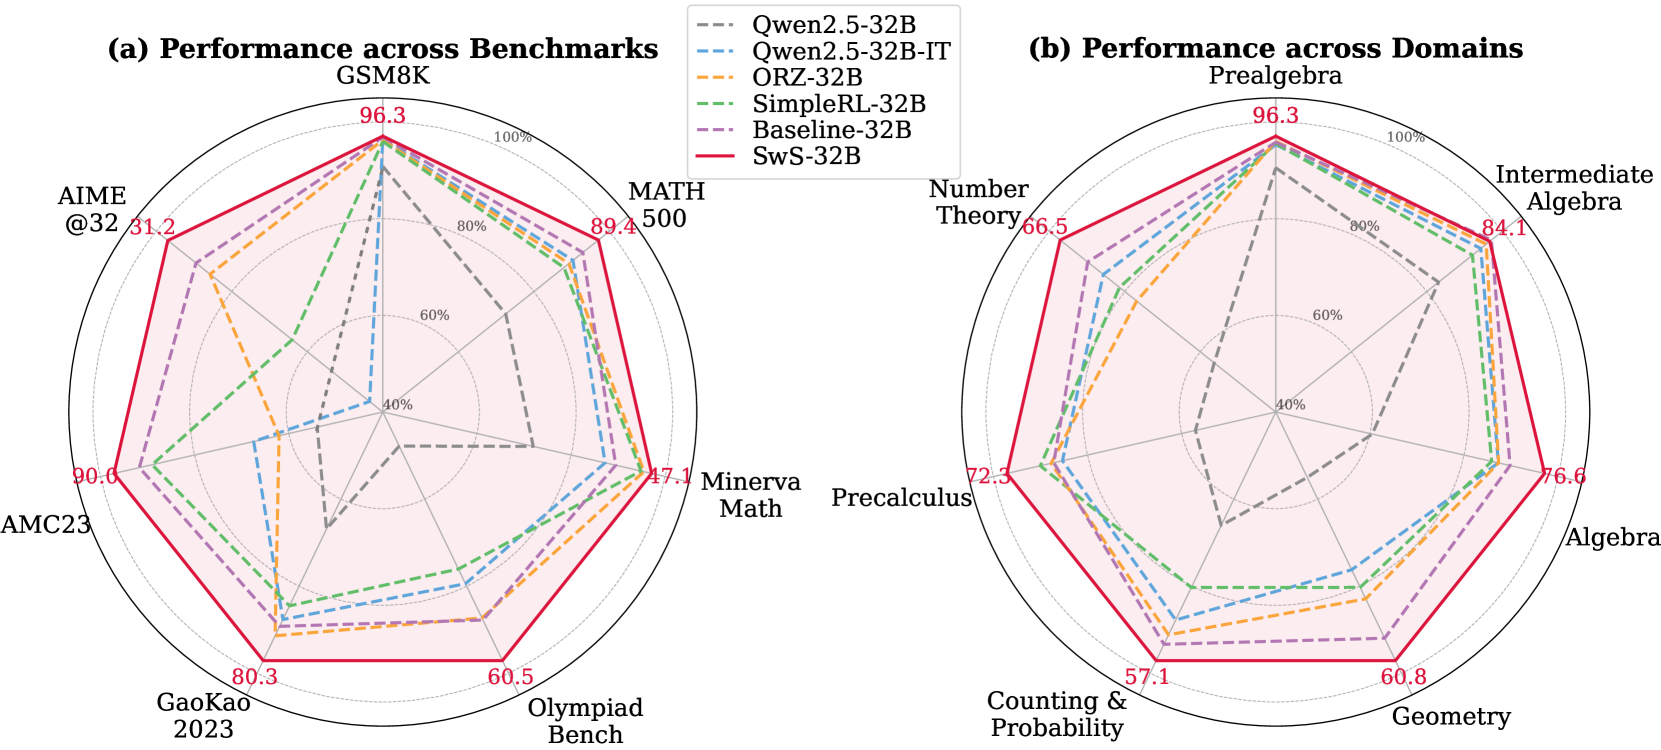
The image displays two radar charts (spider plots) comparing the performance of six different 32-billion-parameter AI models. The charts are labeled (a) and (b), with a shared legend positioned at the top-center between them. The charts use a circular grid with concentric rings representing performance percentages (40%, 60%, 80%, 100%). Each model is represented by a distinct line style and color, plotting its score across multiple axes radiating from the center.
### Components/Axes
* **Legend (Top-Center):** Lists six models with corresponding line styles and colors:
* `Qwen2.5-32B`: Gray, dashed line (`---`)
* `Qwen2.5-32B-IT`: Light blue, dashed line (`---`)
* `ORZ-32B`: Orange, dashed line (`---`)
* `SimpleRL-32B`: Green, dashed line (`---`)
* `Baseline-32B`: Purple, dashed line (`---`)
* `SwS-32B`: Red, solid line (`—`)
* **Chart (a) - Performance across Benchmarks:**
* **Axes (7 total, clockwise from top):** GSM8K, MATH 500, Minerva Math, Olympiad Bench, GaoKao 2023, AMC23, AIME @32.
* **Scale:** Concentric rings marked at 40%, 60%, 80%, and 100% (outermost).
* **Chart (b) - Performance across Domains:**
* **Axes (7 total, clockwise from top):** Prealgebra, Intermediate Algebra, Algebra, Geometry, Counting & Probability, Precalculus, Number Theory.
* **Scale:** Identical concentric ring scale as chart (a).
### Detailed Analysis
**Chart (a) - Performance across Benchmarks:**
* **SwS-32B (Red, Solid Line):** Consistently forms the outermost polygon, indicating top performance across all benchmarks. Specific labeled scores (red text) are: GSM8K: 96.3, MATH 500: 89.4, Minerva Math: 47.1, Olympiad Bench: 60.5, GaoKao 2023: 80.3, AMC23: 90.6, AIME @32: 31.2.
* **Other Models:** Generally form nested polygons inside the SwS-32B line. The gray dashed line (`Qwen2.5-32B`) is often the innermost, indicating the lowest performance on most benchmarks shown. The purple (`Baseline-32B`) and green (`SimpleRL-32B`) lines are frequently the next closest to the red line.
* **Trend Verification:** All models show a similar *relative* performance pattern across benchmarks. They score highest on GSM8K and AMC23, moderately on MATH 500 and GaoKao 2023, and lowest on the more specialized Olympiad Bench, Minerva Math, and AIME @32. The red line's shape is a scaled-up version of the others.
**Chart (b) - Performance across Domains:**
* **SwS-32B (Red, Solid Line):** Again forms the outermost polygon. Specific labeled scores (red text) are: Prealgebra: 96.3, Intermediate Algebra: 84.1, Algebra: 76.6, Geometry: 60.8, Counting & Probability: 57.1, Precalculus: 72.3, Number Theory: 66.5.
* **Other Models:** The nesting pattern is similar to chart (a). The gray dashed line (`Qwen2.5-32B`) is again the innermost. The purple (`Baseline-32B`) line is notably strong in Precalculus and Number Theory, nearly matching the red line on those axes.
* **Trend Verification:** All models perform best in Prealgebra and Intermediate Algebra. Performance generally decreases for more advanced domains like Geometry, Counting & Probability, and Number Theory. The red line maintains a consistent lead across all domains.
### Key Observations
1. **Dominant Model:** The `SwS-32B` model (red solid line) demonstrates superior performance across every benchmark and every mathematical domain presented in these charts.
2. **Performance Hierarchy:** A clear and consistent hierarchy is visible: `SwS-32B` > `Baseline-32B`/`SimpleRL-32B` > `ORZ-32B` > `Qwen2.5-32B-IT` > `Qwen2.5-32B`. The exact order between `Baseline-32B` and `SimpleRL-32B` varies slightly by axis.
3. **Benchmark Difficulty:** The AIME @32 and Minerva Math benchmarks appear to be the most challenging, as all models score below 50% on them (with SwS-32B at 31.2 and 47.1, respectively).
4. **Domain Strength:** All models show relative strength in foundational algebra topics (Prealgebra, Intermediate Algebra) and relative weakness in combinatorial and geometric topics (Counting & Probability, Geometry).
### Interpretation
These radar charts provide a multidimensional comparison of AI model capabilities in mathematics. The data suggests that the training or architectural approach used for `SwS-32B` yields significant and consistent improvements over the other compared models (`Qwen2.5-32B`, `ORZ-32B`, `SimpleRL-32B`, and a `Baseline-32B`). The fact that the performance *pattern* (the shape of the polygon) is similar across all models indicates that the relative difficulty of these mathematical tasks is consistent; the models differ in their overall capability level, not in their specialized strengths/weaknesses.
The charts effectively argue that `SwS-32B` is a state-of-the-art model for mathematical reasoning within this 32B parameter class. The inclusion of both broad benchmarks (like GSM8K) and specialized domains (like Number Theory) shows that its advantage is comprehensive. For a researcher or user, this visualization implies that choosing `SwS-32B` would likely lead to better performance on a wide range of mathematical problems, from grade-school arithmetic to competition-level algebra and calculus. The clear visual gap between the red line and the others is a powerful indicator of a meaningful performance leap.