## Bar Chart: R1-Qwen | GPQA-D
### Overview
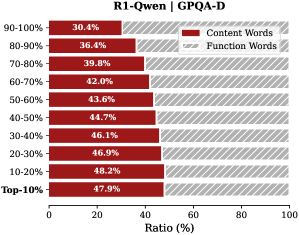
The image is a horizontal bar chart comparing the ratio of "Content Words" and "Function Words" across different percentile ranges (Top-10% to 90-100%) for the R1-Qwen model on the GPQA-D dataset. The chart shows how the proportion of content words changes as we move from the top-performing samples to the lower-performing ones.
### Components/Axes
* **Title:** R1-Qwen | GPQA-D
* **Y-axis (Vertical):** Percentile ranges: Top-10%, 10-20%, 20-30%, 30-40%, 40-50%, 50-60%, 60-70%, 70-80%, 80-90%, 90-100%.
* **X-axis (Horizontal):** Ratio (%), ranging from 0 to 100.
* **Legend (Top-Right):**
* Red: Content Words
* Gray with diagonal lines: Function Words
### Detailed Analysis
The chart displays the ratio of content words for each percentile range. The remaining portion of each bar represents the ratio of function words.
* **Top-10%:** Content Words: 47.9%.
* **10-20%:** Content Words: 48.2%.
* **20-30%:** Content Words: 46.9%.
* **30-40%:** Content Words: 46.1%.
* **40-50%:** Content Words: 44.7%.
* **50-60%:** Content Words: 43.6%.
* **60-70%:** Content Words: 42.0%.
* **70-80%:** Content Words: 39.8%.
* **80-90%:** Content Words: 36.4%.
* **90-100%:** Content Words: 30.4%.
**Trend:** The proportion of "Content Words" generally decreases as the percentile range moves from Top-10% to 90-100%.
### Key Observations
* The highest proportion of "Content Words" is observed in the 10-20% range (48.2%).
* The lowest proportion of "Content Words" is observed in the 90-100% range (30.4%).
* There is a noticeable drop in the proportion of "Content Words" in the 90-100% range compared to other ranges.
### Interpretation
The chart suggests that the quality of the generated text, as measured by the proportion of content words, tends to be higher in the top-performing samples (Top-10% to 30-40%) compared to the lower-performing samples (60-70% to 90-100%). This could indicate that better-performing samples rely more on meaningful content words, while lower-performing samples may rely more on function words, potentially resulting in less informative or coherent text. The significant drop in content words in the 90-100% range could indicate a threshold where the quality of generated text significantly deteriorates.