## Scatter Plot: Accuracy vs. Time-to-Answer
### Overview
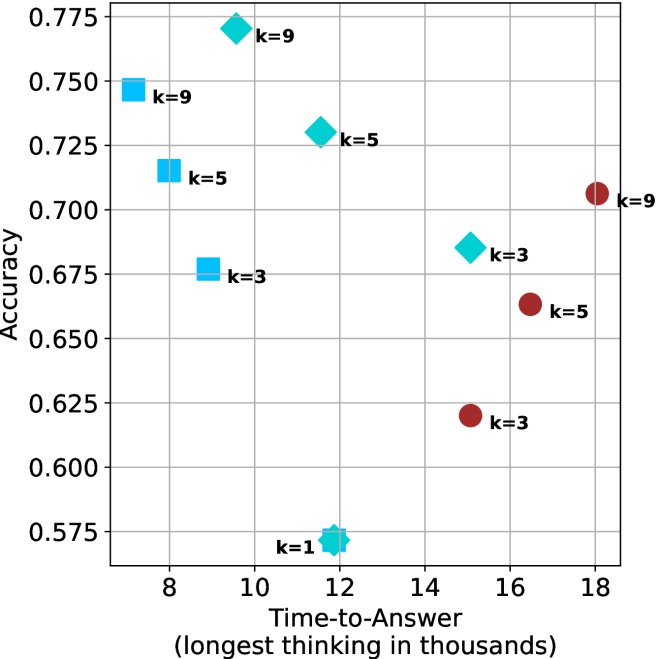
This image is a scatter plot visualizing the relationship between "Time-to-Answer" (computational cost) and "Accuracy" (performance). The data points are categorized by color and shape, with specific labels ('k' values) indicating different parameter settings or model configurations. The plot reveals two distinct clusters of data, suggesting a comparison between two different model architectures or processing methods.
### Components/Axes
* **Y-Axis:** Labeled "Accuracy". The scale ranges from 0.575 to 0.775, with major grid lines at intervals of 0.025.
* **X-Axis:** Labeled "Time-to-Answer (longest thinking in thousands)". The scale ranges from 8 to 18, with major grid lines at intervals of 2.
* **Data Markers:**
* **Light Blue Squares:** Located on the left side of the chart (Time-to-Answer < 10).
* **Light Blue Diamonds:** Located in the upper-middle section of the chart (Time-to-Answer between 9 and 12).
* **Light Blue Star/Flower:** Located at the bottom-center (Time-to-Answer ≈ 12).
* **Dark Red Circles:** Located on the right side of the chart (Time-to-Answer > 14).
* **Labels:** Each data point is annotated with a "k=" value, representing a specific variable (likely a hyperparameter like k-nearest neighbors or similar).
### Detailed Analysis
The data points are distributed across the plot as follows (approximate coordinates):
**Light Blue Group (Left/Center Cluster):**
* **Square (k=9):** Positioned at top-left. X ≈ 7.2, Y ≈ 0.745.
* **Square (k=5):** Positioned at mid-left. X ≈ 8.5, Y ≈ 0.715.
* **Square (k=3):** Positioned at mid-left. X ≈ 8.8, Y ≈ 0.675.
* **Diamond (k=9):** Positioned at top-center. X ≈ 9.5, Y ≈ 0.770.
* **Diamond (k=5):** Positioned at mid-center. X ≈ 11.5, Y ≈ 0.730.
* **Star/Flower (k=1):** Positioned at bottom-center. X ≈ 11.8, Y ≈ 0.570.
**Dark Red Group (Right Cluster):**
* **Circle (k=3):** Positioned at mid-right. X ≈ 15.0, Y ≈ 0.620.
* **Circle (k=5):** Positioned at mid-right. X ≈ 16.5, Y ≈ 0.665.
* **Circle (k=9):** Positioned at mid-right. X ≈ 18.0, Y ≈ 0.705.
### Key Observations
* **Bimodal Distribution:** The data is clearly split into two distinct performance regimes. The Light Blue group (squares/diamonds) achieves higher accuracy with lower time-to-answer. The Dark Red group (circles) requires significantly more time but achieves lower accuracy.
* **Trend in Dark Red Group:** There is a strong positive correlation between the 'k' value and both time and accuracy. As 'k' increases from 3 to 9, the time-to-answer increases linearly, and accuracy improves linearly.
* **Trend in Light Blue Group:** The relationship is less linear. The k=9 diamond is the most accurate point on the entire chart, but it requires more time than the k=9 square.
* **Outlier:** The k=1 (star/flower) marker is the least accurate and has a relatively high time-to-answer compared to the other light blue markers, making it the least efficient configuration in the dataset.
### Interpretation
This chart likely compares two different model architectures or inference strategies.
1. **Efficiency Gap:** The "Light Blue" strategy is vastly superior to the "Dark Red" strategy. It achieves higher accuracy (peaking at ~0.77 vs ~0.70) while consuming significantly less time (max ~12k vs ~18k).
2. **Scaling Behavior:** The "Dark Red" strategy appears to be a model that scales predictably—increasing 'k' adds computational cost but yields consistent accuracy gains.
3. **Optimization:** The "Light Blue" strategy shows that higher 'k' values (specifically k=9) provide the best performance, but the choice of shape (Square vs. Diamond) suggests there may be an underlying architectural difference (e.g., different model sizes or prompt structures) that affects the time-to-answer even when 'k' is held constant.
4. **Conclusion:** If this were a decision-making matrix for model deployment, the "Light Blue" strategy is the clear choice, with the k=9 Diamond being the optimal configuration for high accuracy, and the k=5 Square being a potential candidate if lower latency is required.