\n
## Diagram: Evidence and Innocence Model
### Overview
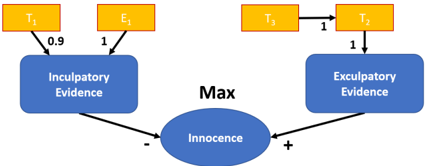
This diagram illustrates a model relating different types of evidence (incriminating and exculpatory) to a conclusion of innocence. It uses boxes to represent evidence categories and an oval to represent the outcome (innocence). Arrows indicate relationships and are labeled with numerical values representing the strength of the connection. The diagram appears to be a simplified representation of a Bayesian network or similar probabilistic reasoning model.
### Components/Axes
The diagram consists of the following components:
* **T1:** A yellow box labeled "T1".
* **E1:** A yellow box labeled "E1".
* **T2:** A yellow box labeled "T2".
* **T3:** A yellow box labeled "T3".
* **Incriminating Evidence:** A blue rectangle labeled "Incriminating Evidence".
* **Exculpatory Evidence:** A blue rectangle labeled "Exculpatory Evidence".
* **Innocence:** A blue oval labeled "Innocence".
* **Max:** Text label "Max" positioned centrally between the "Incriminating Evidence" and "Exculpatory Evidence" boxes.
* **Arrows:** Arrows connecting the boxes and oval, with numerical labels indicating the strength of the relationship.
* **"+" and "-":** Symbols indicating positive and negative influence on "Innocence".
### Detailed Analysis or Content Details
The diagram shows the following relationships:
* An arrow connects "T1" to "Incriminating Evidence" with a label of "0.9".
* An arrow connects "E1" to "Incriminating Evidence" with a label of "1".
* An arrow connects "T2" to "T3" with a label of "1".
* An arrow connects "T3" to "Exculpatory Evidence" with a label of "1".
* An arrow connects "Incriminating Evidence" to "Innocence" with a "-" symbol, indicating a negative influence.
* An arrow connects "Exculpatory Evidence" to "Innocence" with a "+" symbol, indicating a positive influence.
### Key Observations
The diagram suggests that incriminating evidence (formed from T1 and E1) decreases the likelihood of innocence, while exculpatory evidence (formed from T2 and T3) increases it. The numerical labels suggest that E1 has a stronger influence on incriminating evidence than T1 (1 vs 0.9). The connections between T2, T3, and Exculpatory Evidence are all at maximum strength (1).
### Interpretation
This diagram represents a simplified model of how evidence contributes to a determination of innocence. The "Max" label suggests a maximization process, potentially indicating that the model aims to maximize the probability of innocence given the available evidence. The diagram implies that the strength of the evidence (represented by the numerical labels) directly impacts the conclusion of innocence. The model is a conceptual illustration and does not provide specific quantitative details about how the evidence is combined or how the final determination of innocence is made. The diagram is a visual representation of a logical argument, where the presence of incriminating evidence weakens the case for innocence, and the presence of exculpatory evidence strengthens it. The values assigned to the connections suggest a degree of confidence or weight given to each piece of evidence.