## Diagram: Mathematical Problem-Solving Flowchart with Examples
### Overview
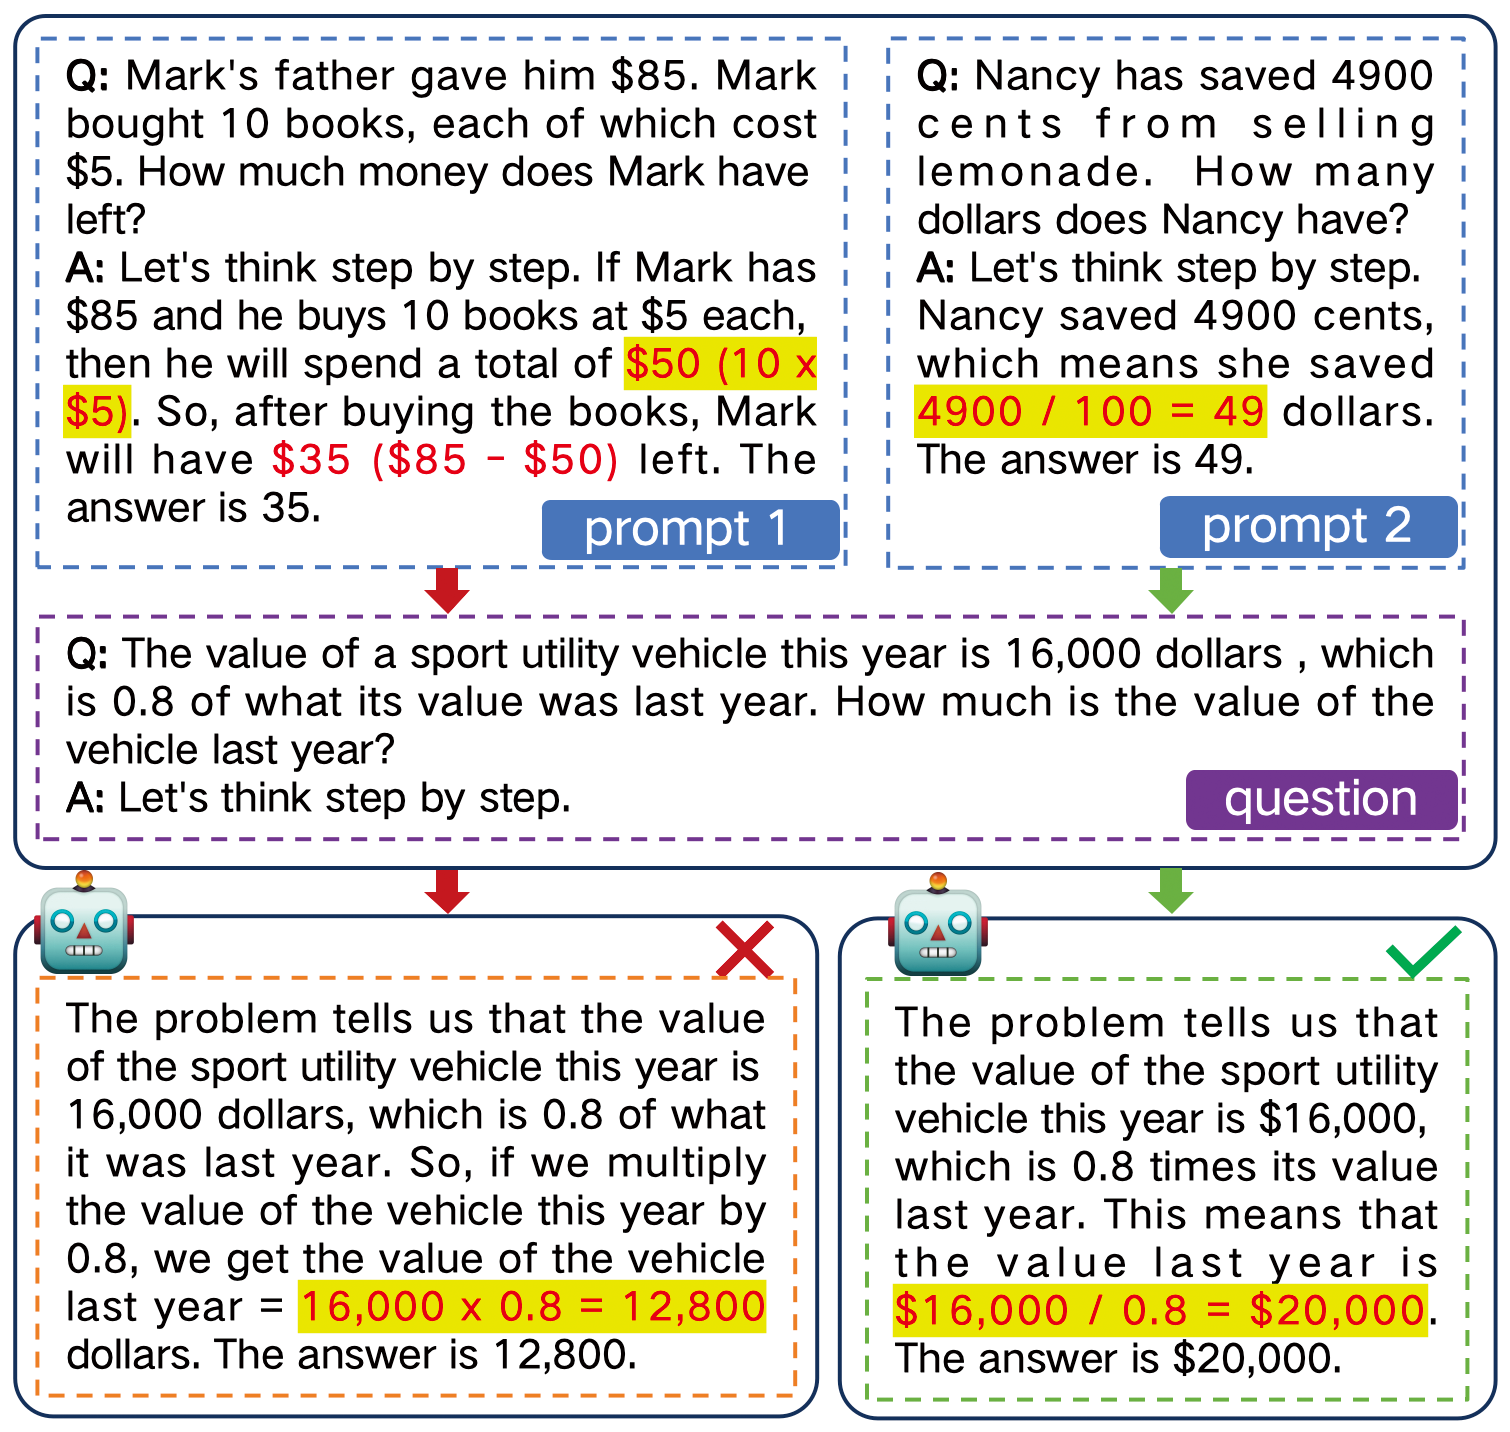
The image is an educational diagram illustrating a step-by-step reasoning process for solving mathematical word problems. It uses two example prompts to demonstrate a method, applies that method to a new question, and then shows both an incorrect and a correct solution path. The diagram is structured with colored borders, arrows, and icons to guide the viewer through the logical flow.
### Components/Axes
The diagram is organized into four main rectangular boxes, connected by arrows.
1. **Top-Left Box (Prompt 1):**
* **Border:** Blue dashed line.
* **Label:** A blue button labeled "prompt 1" in the bottom-right corner.
* **Content:** A question and answer pair about Mark's money.
2. **Top-Right Box (Prompt 2):**
* **Border:** Blue dashed line.
* **Label:** A blue button labeled "prompt 2" in the bottom-right corner.
* **Content:** A question and answer pair about Nancy's savings.
3. **Central Box (Question):**
* **Border:** Purple dashed line.
* **Label:** A purple button labeled "question" in the bottom-right corner.
* **Content:** A new word problem about the value of a sport utility vehicle (SUV).
* **Arrows:** A red arrow points down from Prompt 1 to this box. A green arrow points down from Prompt 2 to this box.
4. **Bottom-Left Box (Incorrect Answer):**
* **Border:** Orange dashed line.
* **Icon:** A robot head icon in the top-left corner.
* **Symbol:** A red "X" in the top-right corner.
* **Content:** An incorrect step-by-step solution to the SUV problem.
* **Arrow:** A red arrow points down from the central Question box to this box.
5. **Bottom-Right Box (Correct Answer):**
* **Border:** Green dashed line.
* **Icon:** A robot head icon in the top-left corner.
* **Symbol:** A green checkmark in the top-right corner.
* **Content:** The correct step-by-step solution to the SUV problem.
* **Arrow:** A green arrow points down from the central Question box to this box.
### Detailed Analysis / Content Details
**Prompt 1 (Top-Left):**
* **Q:** Mark's father gave him $85. Mark bought 10 books, each of which cost $5. How much money does Mark have left?
* **A:** Let's think step by step. If Mark has $85 and he buys 10 books at $5 each, then he will spend a total of **$50 (10 x $5)**. So, after buying the books, Mark will have **$35 ($85 - $50)** left. The answer is 35.
* *Note: The calculation "$50 (10 x $5)" is highlighted in yellow.*
**Prompt 2 (Top-Right):**
* **Q:** Nancy has saved 4900 cents from selling lemonade. How many dollars does Nancy have?
* **A:** Let's think step by step. Nancy saved 4900 cents, which means she saved **4900 / 100 = 49** dollars. The answer is 49.
* *Note: The calculation "4900 / 100 = 49" is highlighted in yellow.*
**Central Question:**
* **Q:** The value of a sport utility vehicle this year is 16,000 dollars, which is 0.8 of what its value was last year. How much is the value of the vehicle last year?
* **A:** Let's think step by step.
**Incorrect Answer (Bottom-Left):**
* The problem tells us that the value of the sport utility vehicle this year is 16,000 dollars, which is 0.8 of what it was last year. So, if we multiply the value of the vehicle this year by 0.8, we get the value of the vehicle last year = **16,000 x 0.8 = 12,800** dollars. The answer is 12,800.
* *Note: The calculation "16,000 x 0.8 = 12,800" is highlighted in yellow.*
**Correct Answer (Bottom-Right):**
* The problem tells us that the value of the sport utility vehicle this year is $16,000, which is 0.8 times its value last year. This means that the value last year is **$16,000 / 0.8 = $20,000**. The answer is $20,000.
* *Note: The calculation "$16,000 / 0.8 = $20,000" is highlighted in yellow.*
### Key Observations
1. **Visual Coding:** The diagram uses color consistently to indicate correctness and flow. Red (borders, arrows, "X") is associated with the incorrect path. Green (borders, arrows, checkmark) is associated with the correct path. Blue is used for the initial example prompts.
2. **Structural Flow:** The arrows create a clear visual narrative: two example methods (Prompts 1 & 2) inform the approach to a new problem (Question), which then branches into two possible outcomes (Incorrect vs. Correct Answer).
3. **Highlighting:** Key mathematical operations within the solutions are highlighted in yellow to draw attention to the core calculation step.
4. **Iconography:** Robot head icons are placed on the answer boxes, personifying the "solver" or AI agent performing the reasoning.
### Interpretation
This diagram serves as a pedagogical tool to teach or demonstrate a specific problem-solving strategy, likely for training AI models or teaching students. The core lesson is about correctly interpreting the phrase "is 0.8 of what its value was last year."
* **The Error:** The incorrect solution misinterprets the relationship. It treats "0.8 of last year's value" as a multiplier to apply to this year's value to find last year's value, leading to the erroneous operation `16,000 * 0.8`.
* **The Correction:** The correct solution properly sets up the equation: `This Year's Value = 0.8 * Last Year's Value`. To find the unknown (Last Year's Value), it correctly performs the inverse operation: `Last Year's Value = This Year's Value / 0.8`.
* **Underlying Principle:** The diagram emphasizes the importance of translating word problems into correct mathematical equations before performing calculations. It visually contrasts a common mistake (applying the multiplier directly) with the correct algebraic approach (using division to isolate the unknown variable). The inclusion of two simpler, correct prompts at the top establishes a pattern of "step-by-step" reasoning that the final question is meant to follow, making the incorrect answer's deviation from that pattern more salient.