## Line Graph: N=50, CIFAR-100 Test Accuracy vs. Communication Rounds
### Overview
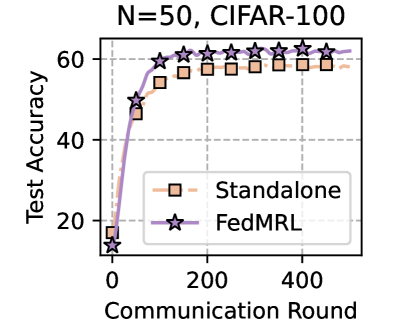
The image is a line graph comparing the test accuracy of two machine learning models ("Standalone" and "FedML") over communication rounds during training on the CIFAR-100 dataset with 50 clients. The y-axis represents test accuracy (0–60%), and the x-axis represents communication rounds (0–400). The graph includes a legend in the bottom-right corner and gridlines for reference.
---
### Components/Axes
- **Title**: "N=50, CIFAR-100" (top-center).
- **Y-Axis**: "Test Accuracy" (0–60%, labeled vertically on the left).
- **X-Axis**: "Communication Round" (0–400, labeled horizontally at the bottom).
- **Legend**: Located in the bottom-right corner, with:
- **Orange squares**: "Standalone" model.
- **Purple stars**: "FedML" model.
- **Gridlines**: Dashed lines at x=0, 100, 200, 300, 400 and y=0, 20, 40, 60.
---
### Detailed Analysis
1. **Standalone Model (Orange Squares)**:
- Starts at ~15% accuracy at 0 rounds.
- Increases sharply to ~55% by 100 rounds.
- Plateaus near 55% for subsequent rounds (200–400).
2. **FedML Model (Purple Stars)**:
- Starts at ~10% accuracy at 0 rounds.
- Rises steeply to surpass Standalone (~60%) by ~200 rounds.
- Maintains ~60% accuracy for rounds 200–400.
---
### Key Observations
- **Performance Divergence**: FedML outperforms Standalone after ~200 rounds, achieving higher accuracy with fewer rounds.
- **Plateau Effect**: Both models plateau before 400 rounds, suggesting diminishing returns.
- **Efficiency**: FedML reaches ~60% accuracy by ~200 rounds, while Standalone requires ~100 rounds to reach ~55%.
---
### Interpretation
The data demonstrates that **FedML** is more efficient for distributed learning on CIFAR-100 with 50 clients, achieving higher accuracy with fewer communication rounds compared to the Standalone model. The plateau effect indicates that increasing rounds beyond ~200 provides minimal gains, likely due to model saturation or overfitting. This suggests FedML’s federated learning framework optimizes resource usage, making it preferable for large-scale, resource-constrained environments. The Standalone model’s slower convergence highlights the limitations of non-distributed training in such scenarios.