\n
## Line Chart: N=50, CIFAR-100 Test Accuracy vs. Communication Round
### Overview
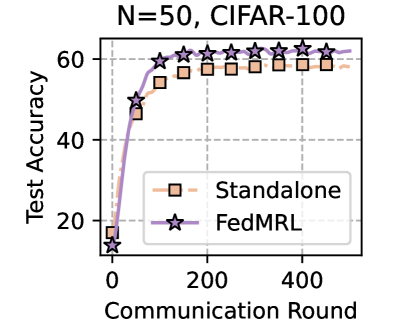
The image is a line chart comparing the test accuracy of two machine learning training methods over communication rounds in a federated learning context. The chart is titled "N=50, CIFAR-100," indicating the experiment involves 50 clients (or agents) and uses the CIFAR-100 image classification dataset. The plot shows two data series: "Standalone" and "FedMRL," both demonstrating learning curves that improve with more communication rounds.
### Components/Axes
* **Title:** "N=50, CIFAR-100" (Top center)
* **Y-Axis:** Label is "Test Accuracy". Scale ranges from 20 to 60, with major tick marks at 20, 40, and 60. The axis appears to start slightly below 20.
* **X-Axis:** Label is "Communication Round". Scale ranges from 0 to 400, with major tick marks at 0, 200, and 400.
* **Legend:** Located in the bottom-right quadrant of the chart area.
* **Standalone:** Represented by an orange line with square markers (□).
* **FedMRL:** Represented by a purple line with star markers (☆).
* **Grid:** A light gray dashed grid is present in the background.
### Detailed Analysis
**Data Series & Trends:**
1. **Standalone (Orange Squares):**
* **Trend:** The line shows a steep initial increase in accuracy followed by a gradual plateau. It starts low and rises quickly before the rate of improvement slows significantly after approximately 100-150 rounds.
* **Approximate Data Points:**
* Round 0: ~15% accuracy
* Round 50: ~45% accuracy
* Round 100: ~55% accuracy
* Round 150: ~57% accuracy
* Round 200: ~58% accuracy
* Round 250: ~58% accuracy
* Round 300: ~58% accuracy
* Round 350: ~58% accuracy
* Round 400: ~58% accuracy
2. **FedMRL (Purple Stars):**
* **Trend:** This line also shows a steep initial rise, but it consistently achieves higher accuracy than the Standalone method after the very first data point. It continues to improve slightly even in later rounds where the Standalone method has plateaued.
* **Approximate Data Points:**
* Round 0: ~15% accuracy (similar starting point to Standalone)
* Round 50: ~50% accuracy
* Round 100: ~60% accuracy
* Round 150: ~61% accuracy
* Round 200: ~62% accuracy
* Round 250: ~62% accuracy
* Round 300: ~62% accuracy
* Round 350: ~62% accuracy
* Round 400: ~62% accuracy
**Spatial Grounding:** The FedMRL (purple star) line is positioned vertically above the Standalone (orange square) line for all communication rounds after 0. The legend is placed in the bottom-right, not obscuring the primary data trends which are concentrated in the left and center of the plot.
### Key Observations
1. **Performance Gap:** The FedMRL method demonstrates a clear and consistent performance advantage over the Standalone method. The gap is established early (by round 50) and maintained throughout the experiment.
2. **Convergence Behavior:** Both methods show logarithmic-style learning curves. The Standalone method appears to converge to a final accuracy of approximately 58%. The FedMRL method converges to a higher final accuracy of approximately 62%.
3. **Initial Learning Rate:** Both methods learn rapidly in the first 50-100 communication rounds. FedMRL's initial slope is slightly steeper.
4. **Plateau:** After round ~200, both curves show minimal improvement, indicating convergence for this experimental setup.
### Interpretation
This chart presents empirical evidence comparing two federated learning strategies on the CIFAR-100 task with 50 participants. The "Standalone" line likely represents a baseline where clients train independently or with minimal collaboration. "FedMRL" represents a proposed collaborative method (the name suggests it involves Federated Learning and Meta-Reinforcement Learning or a similar technique).
The data suggests that the FedMRL strategy is more effective than the standalone approach for this specific task and configuration. It not only achieves a higher final model accuracy (~4 percentage points higher) but also reaches a high level of performance faster (e.g., it hits 60% accuracy around round 100, a level the Standalone method never reaches). This implies that the collaborative mechanism in FedMRL successfully leverages the distributed data from the 50 clients to build a superior global model. The persistent gap indicates the benefit is not transient but leads to a better final converged model. The experiment demonstrates the value of the FedMRL algorithm for improving model performance in a federated learning setting with a non-IID image classification dataset.