\n
## 3D Surface Plot: Function Visualization
### Overview
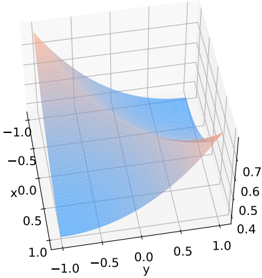
The image depicts a 3D surface plot, visualizing a function of two variables, 'x' and 'y'. The surface is colored with a gradient, transitioning from a light blue to a light orange. The plot is rendered in a perspective view, showing the surface extending from a base plane defined by the x and y axes, with the z-axis representing the function's output. There is no explicit legend or labels for the color gradient.
### Components/Axes
* **X-axis:** Labeled 'x', ranging approximately from -1.0 to 1.0.
* **Y-axis:** Labeled 'y', ranging approximately from -1.0 to 1.0.
* **Z-axis:** Represents the function's value, ranging approximately from 0.4 to 0.7.
* **Surface:** The plotted surface represents the function's output for different combinations of x and y values. The surface is divided into two distinct color regions.
### Detailed Analysis
The surface exhibits a clear curvature.
* **Blue Region:** The blue region occupies the majority of the surface, extending from approximately x = -1.0 to x = 0.5 and y = -1.0 to y = 1.0. The z-values in this region appear to be relatively constant, around 0.5 to 0.6.
* **Orange Region:** The orange region is located on the right side of the plot, extending from approximately x = 0.5 to x = 1.0 and y = -1.0 to y = 1.0. The z-values in this region decrease as x increases, ranging from approximately 0.6 to 0.4.
The surface appears to be smooth and continuous, with no sharp edges or discontinuities. The transition between the blue and orange regions is gradual.
### Key Observations
* The function appears to have a maximum value around x = -1.0 and y = 0.0.
* The function decreases as x increases beyond approximately x = 0.5.
* The function is relatively insensitive to changes in y, particularly in the blue region.
* The color gradient does not have a clear numerical mapping, but it visually represents the function's value.
### Interpretation
The plot visualizes a function that is relatively flat across a large portion of its domain (the blue region). As the x-value increases beyond a certain point, the function begins to decrease. The shape of the surface suggests a possible quadratic or polynomial function. The absence of a legend makes it difficult to determine the exact relationship between the color gradient and the function's value, but it appears to be a visual aid to highlight the surface's curvature and relative height. The plot could be representing a simplified model of a physical phenomenon, such as the height of a landscape or the distribution of a scalar field. Without further information about the function itself, it is difficult to draw more specific conclusions.