## Chart Type: Line Graphs Comparing "I-Don't-Know" Rates of Mistral-7B Models
### Overview
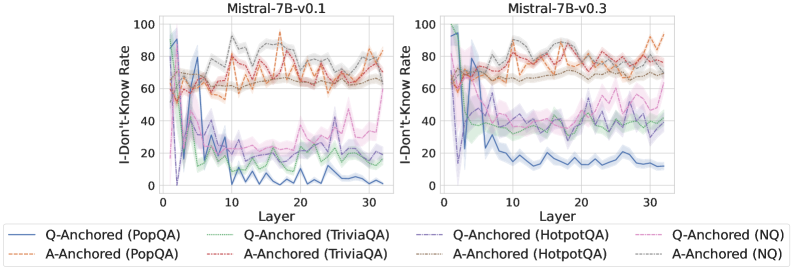
The image presents two line graphs side-by-side, comparing the "I-Don't-Know" rates of two versions of the Mistral-7B model (v0.1 and v0.3) across different layers. Each graph plots the "I-Don't-Know" rate against the layer number for various question-answering datasets, distinguished by different line styles and colors. The x-axis represents the layer number, ranging from 0 to 30. The y-axis represents the "I-Don't-Know" rate, ranging from 0 to 100.
### Components/Axes
* **Titles:**
* Left Graph: "Mistral-7B-v0.1"
* Right Graph: "Mistral-7B-v0.3"
* **X-Axis:**
* Label: "Layer"
* Scale: 0 to 30, with tick marks at intervals of 10.
* **Y-Axis:**
* Label: "I-Don't-Know Rate"
* Scale: 0 to 100, with tick marks at intervals of 20.
* **Legend:** Located at the bottom of the image, describing the different data series:
* Blue solid line: "Q-Anchored (PopQA)"
* Brown dashed line: "A-Anchored (PopQA)"
* Green dotted line: "Q-Anchored (TriviaQA)"
* Orange dashed-dotted line: "A-Anchored (TriviaQA)"
* Pink dashed line: "Q-Anchored (HotpotQA)"
* Gray dotted line: "A-Anchored (HotpotQA)"
* Purple dashed-dotted line: "Q-Anchored (NQ)"
* Black dotted line: "A-Anchored (NQ)"
### Detailed Analysis
**Left Graph: Mistral-7B-v0.1**
* **Q-Anchored (PopQA) (Blue solid line):** Starts high (around 60-70) and rapidly decreases to around 10-20 by layer 10, then fluctuates between 0 and 20 for the remaining layers.
* **A-Anchored (PopQA) (Brown dashed line):** Starts around 60-70 and remains relatively stable between 60 and 80 across all layers, with some fluctuations.
* **Q-Anchored (TriviaQA) (Green dotted line):** Starts around 60-70 and decreases to around 10-20 by layer 10, then fluctuates between 10 and 30 for the remaining layers.
* **A-Anchored (TriviaQA) (Orange dashed-dotted line):** Starts around 60-70 and remains relatively stable between 60 and 80 across all layers, with some fluctuations.
* **Q-Anchored (HotpotQA) (Pink dashed line):** Starts around 40-50 and decreases to around 20-30 by layer 10, then fluctuates between 20 and 40 for the remaining layers.
* **A-Anchored (HotpotQA) (Gray dotted line):** Starts around 70-80 and remains relatively stable between 70 and 90 across all layers, with some fluctuations.
* **Q-Anchored (NQ) (Purple dashed-dotted line):** Starts around 40-50 and decreases to around 10-20 by layer 10, then fluctuates between 10 and 30 for the remaining layers.
* **A-Anchored (NQ) (Black dotted line):** Starts around 70-80 and remains relatively stable between 70 and 90 across all layers, with some fluctuations.
**Right Graph: Mistral-7B-v0.3**
* **Q-Anchored (PopQA) (Blue solid line):** Starts high (around 90-100) and rapidly decreases to around 10-20 by layer 10, then fluctuates between 10 and 20 for the remaining layers.
* **A-Anchored (PopQA) (Brown dashed line):** Starts around 60-70 and remains relatively stable between 60 and 80 across all layers, with some fluctuations.
* **Q-Anchored (TriviaQA) (Green dotted line):** Starts around 60-70 and decreases to around 10-20 by layer 10, then fluctuates between 10 and 30 for the remaining layers.
* **A-Anchored (TriviaQA) (Orange dashed-dotted line):** Starts around 70-80 and remains relatively stable between 70 and 90 across all layers, with some fluctuations.
* **Q-Anchored (HotpotQA) (Pink dashed line):** Starts around 60-70 and decreases to around 30-40 by layer 10, then fluctuates between 30 and 50 for the remaining layers.
* **A-Anchored (HotpotQA) (Gray dotted line):** Starts around 70-80 and remains relatively stable between 70 and 90 across all layers, with some fluctuations.
* **Q-Anchored (NQ) (Purple dashed-dotted line):** Starts around 60-70 and decreases to around 20-30 by layer 10, then fluctuates between 20 and 40 for the remaining layers.
* **A-Anchored (NQ) (Black dotted line):** Starts around 70-80 and remains relatively stable between 70 and 90 across all layers, with some fluctuations.
### Key Observations
* For both Mistral-7B-v0.1 and Mistral-7B-v0.3, the "I-Don't-Know" rate for Q-Anchored datasets (PopQA, TriviaQA, HotpotQA, NQ) generally decreases in the initial layers (0-10) and then stabilizes.
* The "I-Don't-Know" rate for A-Anchored datasets (PopQA, TriviaQA, HotpotQA, NQ) remains relatively stable across all layers for both versions of the model.
* The initial "I-Don't-Know" rate for Q-Anchored (PopQA) is higher in Mistral-7B-v0.3 compared to Mistral-7B-v0.1.
### Interpretation
The graphs suggest that the Mistral-7B models handle question-anchored and answer-anchored datasets differently. The decreasing "I-Don't-Know" rate for Q-Anchored datasets in the initial layers indicates that the model is learning to answer these questions as it processes the input through the layers. The stable "I-Don't-Know" rate for A-Anchored datasets suggests that the model may be less sensitive to the layer number when the answer is provided as context. The higher initial "I-Don't-Know" rate for Q-Anchored (PopQA) in Mistral-7B-v0.3 might indicate a change in the model's initial processing of this specific dataset. Overall, the data highlights the importance of considering the anchoring method (question vs. answer) when evaluating the performance of language models on question-answering tasks.