## Bar Charts: Token Processing Speed Comparison Across Llama 3.1 Model Variants
### Overview
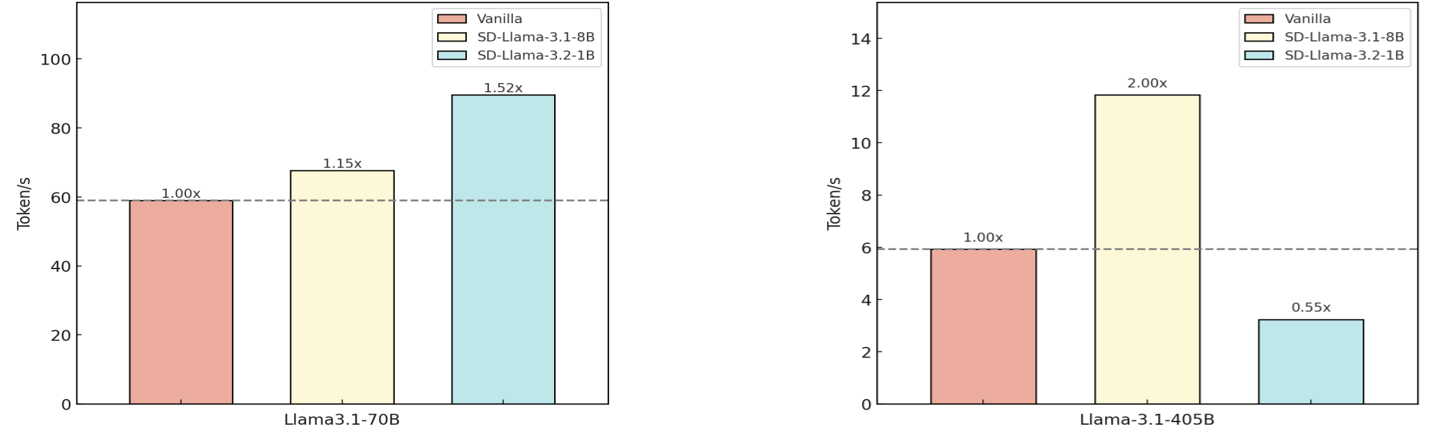
The image contains two side-by-side bar charts comparing token processing speeds (tokens/second) for different Llama 3.1 model variants. Each chart evaluates three configurations: Vanilla, SD-Llama 3.1-8B, and SD-Llama 3.2-1B. The charts use color-coded bars with explicit performance multipliers relative to the Vanilla baseline.
### Components/Axes
- **X-Axes**:
- Left chart: "Llama 3.1-70B" (model size)
- Right chart: "Llama 3.1-405B" (model size)
- **Y-Axes**:
- Both charts: "Token/s" (tokens processed per second)
- Left chart y-axis range: 0–100
- Right chart y-axis range: 0–14
- **Legends**:
- Top-right corner of each chart
- Color coding:
- Red: Vanilla
- Yellow: SD-Llama 3.1-8B
- Blue: SD-Llama 3.2-1B
- **Additional Elements**:
- Dashed horizontal reference lines:
- Left chart: 60 tokens/s
- Right chart: 6 tokens/s
### Detailed Analysis
#### Left Chart (Llama 3.1-70B)
- **Vanilla**: 60 tokens/s (1.00x baseline)
- **SD-Llama 3.1-8B**: 67.5 tokens/s (1.15x)
- **SD-Llama 3.2-1B**: 90 tokens/s (1.52x)
#### Right Chart (Llama 3.1-405B)
- **Vanilla**: 6 tokens/s (1.00x baseline)
- **SD-Llama 3.1-8B**: 12 tokens/s (2.00x)
- **SD-Llama 3.2-1B**: 3 tokens/s (0.55x)
### Key Observations
1. **Performance Scaling**:
- SD-Llama 3.2-1B shows **52% improvement** over Vanilla for the 70B model but **45% degradation** for the 405B model.
- SD-Llama 3.1-8B demonstrates **20% improvement** for the 405B model but only **15% improvement** for the 70B model.
2. **Threshold Breaches**:
- SD-Llama 3.2-1B exceeds the 60 tokens/s threshold in the 70B model chart but falls below the 6 tokens/s threshold in the 405B model chart.
3. **Model Size Impact**:
- Larger models (405B) show more dramatic performance divergence between configurations.
### Interpretation
The data reveals a **non-linear relationship** between model size and the effectiveness of SD optimizations. While SD-Llama 3.2-1B significantly outperforms Vanilla for the 70B model, it underperforms for the 405B variant, suggesting potential architectural trade-offs in the SD implementation. The SD-Llama 3.1-8B configuration maintains consistent gains across both model sizes, indicating it may be a more universally effective optimization. The dashed reference lines likely represent target performance thresholds, with the 70B model comfortably exceeding its target while the 405B model struggles to meet baseline expectations in the SD-Llama 3.2-1B configuration. This pattern suggests that model size and optimization strategy interact in complex ways to determine processing efficiency.