## Line Chart: Accuracy vs. Thinking Compute
### Overview
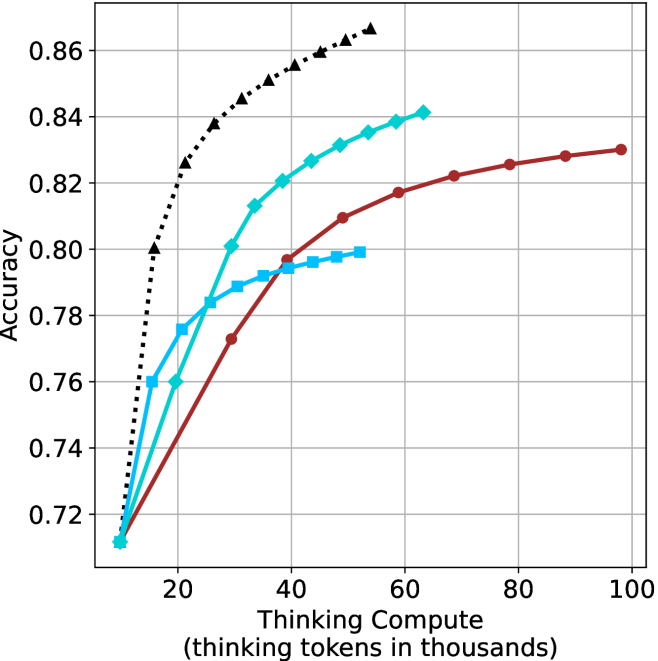
This image is a line chart illustrating the relationship between "Thinking Compute" (measured in thousands of thinking tokens) and "Accuracy." The chart displays four distinct data series, each represented by a unique line color and marker shape. All four series originate from a common starting point and exhibit a positive correlation between compute and accuracy, characterized by diminishing returns as compute increases.
### Components/Axes
* **Y-Axis:** Labeled "Accuracy." The scale ranges from 0.72 to 0.86, with major grid lines at intervals of 0.02.
* **X-Axis:** Labeled "Thinking Compute (thinking tokens in thousands)." The scale ranges from 20 to 100, with major grid lines at intervals of 20. The data series begin at approximately 10k tokens.
* **Legend:** There is no explicit legend provided in the image. The data series are identified by their visual characteristics:
* **Black Dotted Line:** Marked with triangles.
* **Cyan Solid Line:** Marked with diamonds.
* **Blue Solid Line:** Marked with squares.
* **Red/Maroon Solid Line:** Marked with circles.
### Detailed Analysis
All four data series originate at approximately (10, 0.712).
**1. Black Dotted Line (Triangles)**
* **Trend:** This series exhibits the steepest upward slope, indicating the highest efficiency in gaining accuracy per unit of compute.
* **Data Points (Approximate):**
* (15, 0.80)
* (20, 0.825)
* (25, 0.838)
* (30, 0.845)
* (35, 0.85)
* (40, 0.855)
* (45, 0.86)
* (50, 0.863)
* (55, 0.866)
**2. Cyan Solid Line (Diamonds)**
* **Trend:** This series shows a strong upward slope, second only to the black series.
* **Data Points (Approximate):**
* (15, 0.76)
* (20, 0.76)
* (25, 0.785)
* (30, 0.80)
* (35, 0.813)
* (40, 0.82)
* (45, 0.827)
* (50, 0.83)
* (55, 0.835)
* (60, 0.838)
* (65, 0.84)
**3. Blue Solid Line (Squares)**
* **Trend:** This series rises moderately but flattens out significantly after 30k tokens.
* **Data Points (Approximate):**
* (15, 0.76)
* (20, 0.775)
* (25, 0.785)
* (30, 0.79)
* (35, 0.792)
* (40, 0.795)
* (45, 0.796)
* (50, 0.798)
* (55, 0.799)
**4. Red/Maroon Solid Line (Circles)**
* **Trend:** This series has the shallowest slope but continues to scale to the highest compute value (100k tokens).
* **Data Points (Approximate):**
* (20, 0.735)
* (30, 0.773)
* (40, 0.797)
* (50, 0.81)
* (60, 0.817)
* (70, 0.822)
* (80, 0.825)
* (90, 0.828)
* (100, 0.83)
### Key Observations
* **Diminishing Returns:** Every line follows a concave curve, meaning that as "Thinking Compute" increases, the marginal gain in "Accuracy" decreases.