## Performance Comparison: Transformers vs. DynTS
### Overview
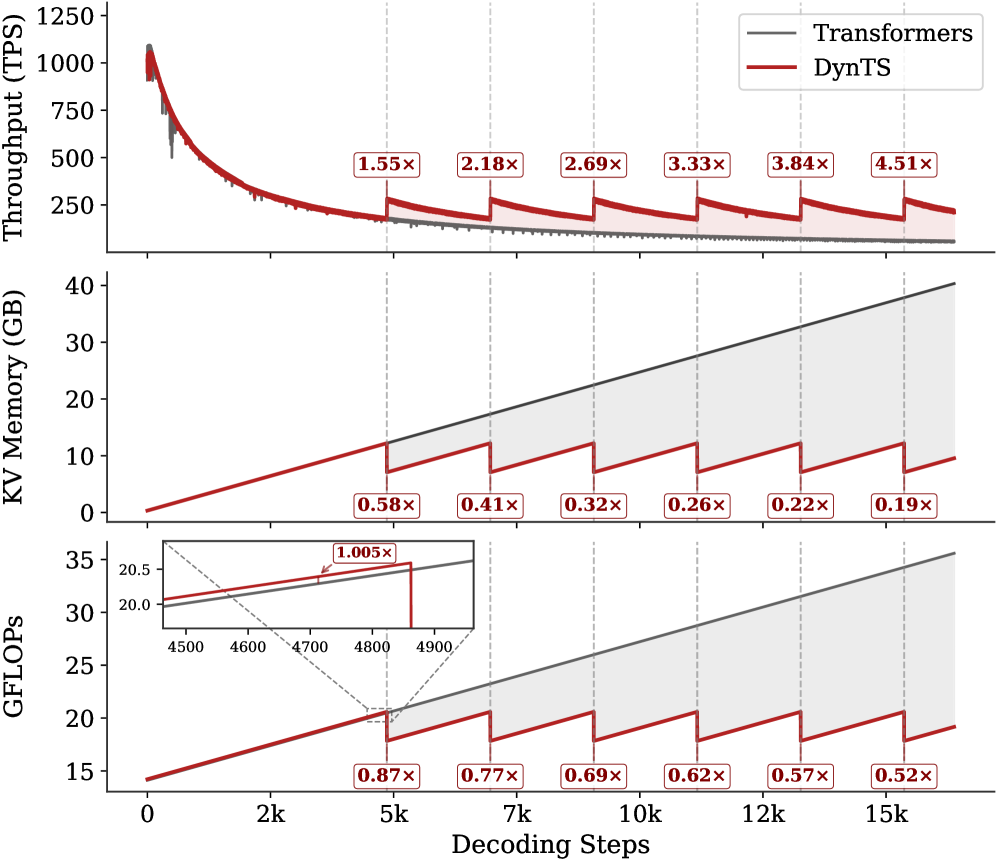
The image presents a comparative performance analysis between "Transformers" (represented by gray lines) and "DynTS" (represented by red lines) across three key metrics: Throughput (TPS), KV Memory (GB), and GFLOPS, plotted against Decoding Steps. The chart aims to illustrate the efficiency and resource utilization of DynTS relative to Transformers during a decoding process. The x-axis represents decoding steps, ranging from 0 to 15k.
### Components/Axes
* **Top Chart:**
* Y-axis: Throughput (TPS), ranging from 0 to 1250.
* X-axis: Decoding Steps (shared across all charts).
* Legend (top-right):
* Transformers (gray line)
* DynTS (red line)
* **Middle Chart:**
* Y-axis: KV Memory (GB), ranging from 0 to 40.
* X-axis: Decoding Steps.
* **Bottom Chart:**
* Y-axis: GFLOPS, ranging from 15 to 35.
* X-axis: Decoding Steps.
* Inset: Zoomed view of GFLOPS between 4500 and 4900 decoding steps, Y-axis ranging from 20.0 to 20.5.
* **X-Axis (shared):** Decoding Steps, labeled from 0 to 15k in increments of 2k, with vertical dashed lines at approximately 5k, 7k, 10k, 12k, and 15k.
### Detailed Analysis
**1. Throughput (TPS):**
* **Transformers (gray):** Starts at approximately 1100 TPS and rapidly decreases to around 200 TPS, then gradually declines further, approaching 100 TPS by 15k decoding steps.
* **DynTS (red):** Starts at approximately 1100 TPS, decreases to around 300 TPS, and then exhibits a saw-tooth pattern, with periodic increases at intervals marked by vertical dashed lines.
* **Ratio Markers:**
* At 5k steps: 1.55x
* At 7k steps: 2.18x
* At 10k steps: 2.69x
* At 12k steps: 3.33x
* At 15k steps: 3.84x
* Beyond 15k steps: 4.51x
**2. KV Memory (GB):**
* **Transformers (gray):** Increases linearly from approximately 0 GB to 40 GB over 15k decoding steps.
* **DynTS (red):** Increases in a saw-tooth pattern, with linear increases followed by sharp drops at intervals marked by vertical dashed lines.
* **Ratio Markers:**
* At 5k steps: 0.58x
* At 7k steps: 0.41x
* At 10k steps: 0.32x
* At 12k steps: 0.26x
* At 15k steps: 0.22x
* Beyond 15k steps: 0.19x
**3. GFLOPS:**
* **Transformers (gray):** Increases linearly from approximately 14 GFLOPS to 34 GFLOPS over 15k decoding steps.
* **DynTS (red):** Increases in a saw-tooth pattern, with linear increases followed by sharp drops at intervals marked by vertical dashed lines.
* **Ratio Markers:**
* At 5k steps: 0.87x
* At 7k steps: 0.77x
* At 10k steps: 0.69x
* At 12k steps: 0.62x
* At 15k steps: 0.57x
* Beyond 15k steps: 0.52x
* **Inset Details:** The inset shows a zoomed-in view around 4500-4900 decoding steps. The Transformers line (gray) is slightly above the DynTS line (red), with a ratio marker of 1.005x near the 4800 step mark.
### Key Observations
* **Throughput:** DynTS maintains a higher throughput than Transformers after the initial drop, as indicated by the ratios greater than 1.
* **KV Memory:** DynTS uses significantly less KV Memory than Transformers, as indicated by the ratios less than 1.
* **GFLOPS:** DynTS requires fewer GFLOPS than Transformers, as indicated by the ratios less than 1.
* **Saw-tooth Pattern:** The saw-tooth pattern in DynTS's KV Memory and GFLOPS usage suggests a periodic memory release or optimization strategy.
### Interpretation
The data suggests that DynTS offers a more efficient alternative to Transformers, particularly in terms of KV Memory usage and GFLOPS. While the initial throughput is similar, DynTS manages to maintain a higher throughput while consuming fewer resources as the decoding process progresses. The saw-tooth pattern indicates a memory management strategy that periodically reduces memory footprint and computational load, leading to improved efficiency. The ratios provided at specific decoding steps quantify the performance gains achieved by DynTS over Transformers. The inset highlights a specific region where the GFLOPS performance is very close, but DynTS still maintains a slight advantage.