TECHNICAL ASSET FINGERPRINT
cece94d8839804c3021ac5ae
Click to view fullscreen
Press ESC or click to close
FOUND IN PAPERS
EXPERT: healer-alpha-free VERSION 1
RUNTIME: free/openrouter/healer-alpha
INTEL_VERIFIED
\n
## Multi-Panel Line Chart: Performance Comparison of Transformers vs. DynTS
### Overview
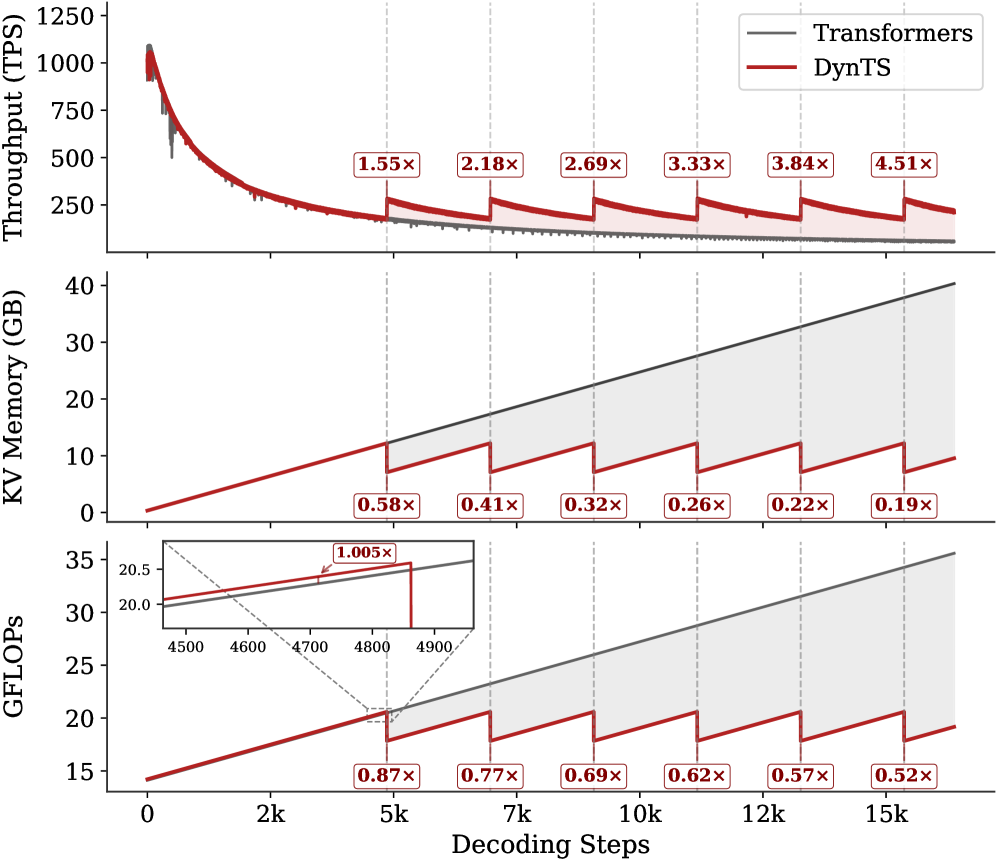
This image is a technical performance comparison chart consisting of three vertically stacked line plots sharing a common x-axis. It compares two systems: "Transformers" (represented by a gray line) and "DynTS" (represented by a red line) across three metrics—Throughput, KV Memory usage, and GFLOPs—as a function of decoding steps. The chart demonstrates the performance advantages of DynTS over standard Transformers, particularly as the sequence length (decoding steps) increases.
### Components/Axes
* **Shared X-Axis (Bottom):**
* **Label:** `Decoding Steps`
* **Scale:** Linear, from 0 to 15,000 (15k).
* **Major Tick Markers:** 0, 2k, 5k, 7k, 10k, 12k, 15k.
* **Top Panel - Y-Axis:**
* **Label:** `Throughput (TPS)` (Transactions Per Second).
* **Scale:** Linear, from 0 to 1250.
* **Major Tick Markers:** 0, 250, 500, 750, 1000, 1250.
* **Middle Panel - Y-Axis:**
* **Label:** `KV Memory (GB)` (Key-Value Memory in Gigabytes).
* **Scale:** Linear, from 0 to 40.
* **Major Tick Markers:** 0, 10, 20, 30, 40.
* **Bottom Panel - Y-Axis:**
* **Label:** `GFLOPs` (Giga Floating-Point Operations).
* **Scale:** Linear, from 15 to 35.
* **Major Tick Markers:** 15, 20, 25, 30, 35.
* **Legend (Top-Right of Top Panel):**
* **Position:** Top-right corner of the topmost chart.
* **Items:**
* A gray line labeled `Transformers`.
* A red line labeled `DynTS`.
* **Annotations:** Each panel contains red-bordered boxes with multiplier values (e.g., `1.55x`, `0.58x`) placed at specific decoding steps (5k, 7k, 10k, 12k, 15k). These indicate the performance ratio of DynTS relative to Transformers at those points.
* **Inset (Bottom Panel):** A small zoomed-in chart within the GFLOPs panel, focusing on the x-axis range of approximately 4500 to 4900 decoding steps.
### Detailed Analysis
**1. Top Panel: Throughput (TPS)**
* **Trend Verification:** Both lines show a steep, concave-upward decline in throughput as decoding steps increase from 0. The gray Transformers line declines smoothly. The red DynTS line follows a similar initial decline but exhibits a distinctive **sawtooth pattern**, with periodic sharp upward jumps followed by gradual declines.
* **Data Points & Annotations:**
* At ~0 steps: Both start near 1100 TPS.
* At 5k steps: DynTS shows a `1.55x` speedup over Transformers.
* At 7k steps: `2.18x` speedup.
* At 10k steps: `2.69x` speedup.
* At 12k steps: `3.33x` speedup.
* At 15k steps: `3.84x` speedup.
* A final annotation at the far right (beyond 15k) shows `4.51x`.
* **Interpretation:** DynTS maintains significantly higher throughput than Transformers as sequence length grows. The sawtooth pattern suggests periodic optimization or state reset events that temporarily boost performance.
**2. Middle Panel: KV Memory (GB)**
* **Trend Verification:** The gray Transformers line shows a **steady, linear increase** in memory usage. The red DynTS line also increases linearly but with a **sawtooth pattern of sharp drops**, resetting to a lower baseline at regular intervals.
* **Data Points & Annotations (DynTS Memory Reduction Factor vs. Transformers):**
* At 5k steps: `0.58x` (DynTS uses 58% of Transformers' memory).
* At 7k steps: `0.41x`.
* At 10k steps: `0.32x`.
* At 12k steps: `0.26x`.
* At 15k steps: `0.22x`.
* At the far right: `0.19x`.
* **Spatial Grounding:** The gray line is consistently above the red line. The shaded area between them represents the memory savings achieved by DynTS, which widens dramatically as steps increase.
* **Interpretation:** Transformers' memory grows without bound, which is a known limitation. DynTS employs a mechanism (likely eviction or compression) that periodically reduces KV cache memory, leading to massive savings (over 80% at 15k steps) and enabling longer context processing.
**3. Bottom Panel: GFLOPs**
* **Trend Verification:** Similar to the memory panel, the gray Transformers line shows a **steady, linear increase** in computational cost. The red DynTS line increases with a **sawtooth pattern of drops**.
* **Inset Analysis:** The inset zooms in on the region around 4500-4900 steps. It shows that just before a drop, DynTS's GFLOPs are slightly higher than Transformers (`1.005x` annotation), indicating a minor overhead before the optimization event triggers a significant reduction.
* **Data Points & Annotations (DynTS GFLOPs Reduction Factor vs. Transformers):**
* At 5k steps: `0.87x`.
* At 7k steps: `0.77x`.
* At 10k steps: `0.69x`.
* At 12k steps: `0.62x`.
* At 15k steps: `0.57x`.
* At the far right: `0.52x`.
* **Interpretation:** DynTS reduces the computational operations required for long-context inference. The savings grow with sequence length, complementing the memory savings and contributing to the higher throughput observed in the top panel.
### Key Observations
1. **Correlated Sawtooth Pattern:** The periodic drops in Memory and GFLOPs for DynTS are perfectly aligned vertically across the middle and bottom panels. These events correspond to the upward jumps in Throughput in the top panel, confirming they are the same optimization mechanism.
2. **Diverging Performance Gap:** The performance advantage of DynTS over Transformers (both in speedup and resource reduction) is not constant; it **widens progressively** as the number of decoding steps increases.
3. **Linear vs. Bounded Growth:** Transformers exhibit linear, unbounded growth in memory and compute. DynTS transforms this into a bounded, sawtooth growth pattern, which is crucial for scalability.
4. **Minor Overhead:** The inset in the GFLOPs chart reveals a very slight (`0.5%`) computational overhead for DynTS immediately before its optimization cycle, which is negligible compared to the subsequent ~50% reduction.
### Interpretation
This chart provides strong empirical evidence for the efficacy of the "DynTS" system in addressing the core scalability challenges of standard Transformer models for long-sequence inference.
* **What the data suggests:** The data demonstrates that DynTS implements a dynamic, periodic optimization strategy for the Key-Value (KV) cache. This strategy successfully curbs the linear growth in memory and computation that plagues standard Transformers.
* **How elements relate:** The three panels are causally linked. The periodic KV cache management events (seen as drops in Memory and GFLOPs) directly cause the periodic boosts in Throughput. This creates a virtuous cycle: saving memory and compute enables higher throughput, which is sustained over longer sequences.
* **Notable Implications:** The widening performance gap indicates that DynTS becomes **increasingly more valuable** for longer contexts. The final `4.51x` throughput and `0.19x` memory usage at extreme lengths suggest it could enable applications (e.g., very long document analysis, extended dialogues) that are prohibitively expensive with standard Transformers. The system trades a tiny, periodic computational overhead for massive, sustained savings in memory and operations, leading to a net positive impact on performance and scalability.
DECODING INTELLIGENCE...