## Bar Chart: Prediction Flip Rate for Llama-3 Models
### Overview
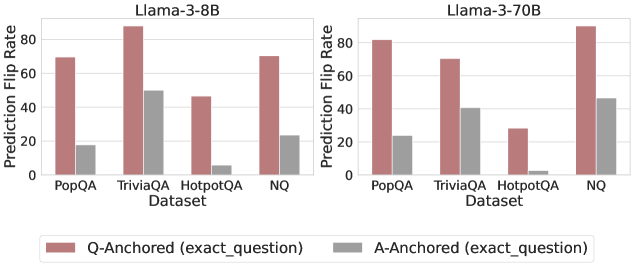
The image presents two bar charts comparing the prediction flip rates of Llama-3-8B and Llama-3-70B models across different datasets (PopQA, TriviaQA, HotpotQA, and NQ). The charts compare "Q-Anchored" (exact_question) and "A-Anchored" (exact_question) scenarios, represented by different colored bars.
### Components/Axes
* **Titles:**
* Left Chart: Llama-3-8B
* Right Chart: Llama-3-70B
* **Y-axis:** Prediction Flip Rate (values ranging from 0 to 80, with increments of 20)
* **X-axis:** Dataset (PopQA, TriviaQA, HotpotQA, NQ)
* **Legend:** Located at the bottom of the image.
* Q-Anchored (exact\_question): Represented by a muted red/brown color.
* A-Anchored (exact\_question): Represented by a gray color.
### Detailed Analysis
**Left Chart: Llama-3-8B**
* **PopQA:**
* Q-Anchored: Approximately 70
* A-Anchored: Approximately 18
* **TriviaQA:**
* Q-Anchored: Approximately 87
* A-Anchored: Approximately 50
* **HotpotQA:**
* Q-Anchored: Approximately 46
* A-Anchored: Approximately 6
* **NQ:**
* Q-Anchored: Approximately 70
* A-Anchored: Approximately 23
**Right Chart: Llama-3-70B**
* **PopQA:**
* Q-Anchored: Approximately 81
* A-Anchored: Approximately 23
* **TriviaQA:**
* Q-Anchored: Approximately 70
* A-Anchored: Approximately 40
* **HotpotQA:**
* Q-Anchored: Approximately 28
* A-Anchored: Approximately 2
* **NQ:**
* Q-Anchored: Approximately 88
* A-Anchored: Approximately 46
### Key Observations
* For both models, the Q-Anchored prediction flip rates are generally higher than the A-Anchored rates across all datasets.
* TriviaQA shows the highest Q-Anchored prediction flip rate for Llama-3-8B.
* NQ shows the highest Q-Anchored prediction flip rate for Llama-3-70B.
* HotpotQA consistently has the lowest prediction flip rates for both models, especially for A-Anchored.
* The 70B model has a higher Q-Anchored flip rate for PopQA and NQ, but a lower Q-Anchored flip rate for TriviaQA and HotpotQA.
### Interpretation
The charts illustrate the prediction flip rates of two Llama-3 models under different anchoring conditions. The higher Q-Anchored rates suggest that the models are more sensitive to changes or perturbations in the question itself. The lower A-Anchored rates indicate greater robustness to variations in the answer context. The differences between datasets highlight the varying challenges they pose to the models. The 70B model appears to be more robust on some datasets (PopQA, NQ) but less so on others (TriviaQA, HotpotQA), suggesting that model size alone does not guarantee improved performance across all tasks. The HotpotQA dataset, with its low flip rates, may be inherently easier or more consistently answered by these models.