## Line Chart: Model Performance Comparison (IFEval vs. Multi-IF)
### Overview
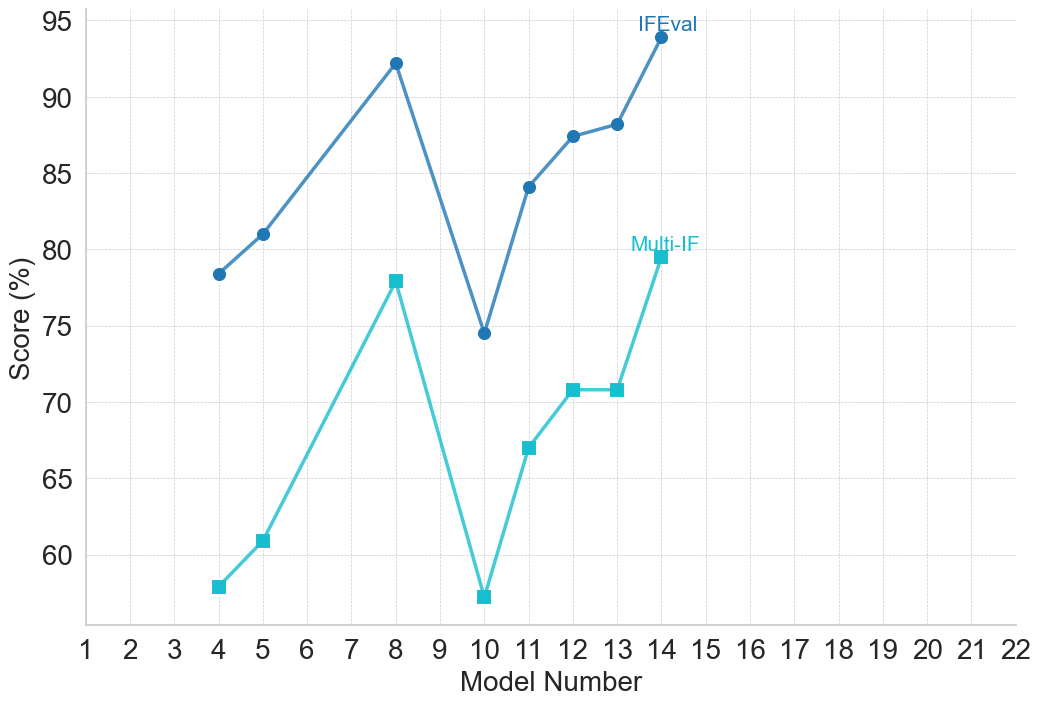
The image is a line chart comparing the performance scores (in percentage) of two different evaluation metrics, "IFEval" and "Multi-IF," across a series of model numbers. The chart displays two distinct data series plotted against a common x-axis representing model numbers.
### Components/Axes
* **Chart Type:** Line chart with markers.
* **X-Axis:**
* **Label:** "Model Number"
* **Scale:** Linear, ranging from 1 to 22.
* **Ticks:** Major ticks at every integer from 1 to 22.
* **Y-Axis:**
* **Label:** "Score (%)"
* **Scale:** Linear, ranging from 60 to 95.
* **Ticks:** Major ticks at intervals of 5 (60, 65, 70, 75, 80, 85, 90, 95).
* **Legend:**
* **Placement:** Embedded within the chart area, positioned in the upper-right quadrant.
* **Series 1:** "IFEval" - Represented by a dark blue line with circular markers.
* **Series 2:** "Multi-IF" - Represented by a light blue (cyan) line with square markers.
* **Grid:** A light gray grid is present, with horizontal lines at each major y-axis tick and vertical lines at each major x-axis tick.
### Detailed Analysis
**Data Series 1: IFEval (Dark Blue Line, Circular Markers)**
* **Trend:** The line shows an overall upward trend with significant volatility. It rises from model 4 to a peak at model 8, experiences a sharp drop at model 10, and then recovers and climbs to its highest point at model 14.
* **Data Points (Approximate):**
* Model 4: ~78.5%
* Model 5: ~81.0%
* Model 8: ~92.5%
* Model 10: ~74.5%
* Model 11: ~84.0%
* Model 12: ~87.5%
* Model 13: ~88.5%
* Model 14: ~94.0%
**Data Series 2: Multi-IF (Light Blue Line, Square Markers)**
* **Trend:** This series follows a pattern very similar to IFEval but at consistently lower score values. It also peaks at model 8, dips sharply at model 10, and then rises again, ending at its second-highest point at model 14.
* **Data Points (Approximate):**
* Model 4: ~58.0%
* Model 5: ~61.0%
* Model 8: ~78.0%
* Model 10: ~57.0%
* Model 11: ~67.0%
* Model 12: ~71.0%
* Model 13: ~71.0%
* Model 14: ~79.5%
### Key Observations
1. **Correlated Performance:** The two metrics are highly correlated. Models that perform well on IFEval also perform well on Multi-IF, and vice-versa. The shape of the two lines is nearly identical.
2. **Consistent Gap:** The IFEval score is consistently higher than the Multi-IF score for every model shown. The gap between them varies, being smallest at model 8 (~14.5 percentage points) and largest at model 10 (~17.5 percentage points).
3. **Significant Dip at Model 10:** Model 10 represents a clear performance trough for both evaluation metrics, breaking the upward trend from models 4-8.
4. **Peak Performance:** Model 14 achieves the highest score for IFEval (~94%), while model 8 achieves the highest score for Multi-IF (~78%).
5. **Data Range:** The plotted data only exists for models 4, 5, 8, 10, 11, 12, 13, and 14. Models 1-3, 6, 7, 9, and 15-22 have no data points.
### Interpretation
This chart likely compares the performance of different versions or configurations of AI models (identified by "Model Number") on two distinct instruction-following or evaluation benchmarks ("IFEval" and "Multi-IF").
* **What the data suggests:** The strong correlation indicates that the underlying capabilities measured by IFEval and Multi-IF are closely related. A model's proficiency in one area is a strong predictor of its proficiency in the other. The consistent gap suggests that the Multi-IF benchmark may be more challenging or measure a stricter subset of skills compared to IFEval.
* **Notable Anomaly:** The sharp, synchronized drop at Model 10 is the most striking feature. This suggests a potential issue with that specific model version—perhaps a regression in training, a change in architecture, or a specific weakness in the types of tasks it was evaluated on. It serves as a critical point for investigation.
* **Progression:** Excluding the dip at model 10, the general trend from model 4 to model 14 is upward, indicating iterative improvement across these model versions on both benchmarks. The final model (14) shows strong performance, particularly on IFEval.
* **Missing Data:** The absence of data for many model numbers (especially the early ones 1-3 and later ones 15-22) limits the ability to see the full developmental trajectory. The chart presents a selective view of the model lineup.