## Bar Chart: Question vs. Thinking Importance Scores
### Overview
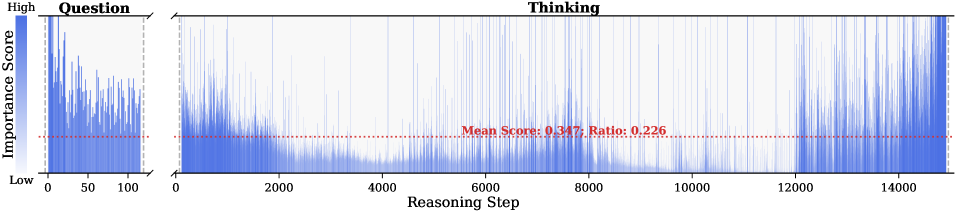
The image presents two bar charts showing "Importance Score" distributions. The left chart, labeled "Question," displays the distribution of importance scores for a question. The right chart, labeled "Thinking," shows the distribution of importance scores over a series of "Reasoning Steps." A color gradient indicates the importance score, ranging from low (light blue) to high (dark blue). A red dotted line indicates the mean score and ratio for the "Thinking" chart.
### Components/Axes
**Left Chart ("Question"):**
* **Title:** Question
* **Y-axis:** Importance Score, ranging from Low to High (indicated by a color gradient from light blue to dark blue).
* **X-axis:** Values ranging from 0 to 100.
**Right Chart ("Thinking"):**
* **Title:** Thinking
* **Y-axis:** Importance Score (same color gradient as the left chart).
* **X-axis:** Reasoning Step, ranging from 0 to 14000.
* **Mean Score and Ratio:** "Mean Score: 0.347; Ratio: 0.226" (indicated by a red dotted line).
### Detailed Analysis
**Left Chart ("Question"):**
* The bars are concentrated between 0 and 100 on the x-axis.
* The importance scores vary, with some bars reaching the "High" end of the color gradient.
* The distribution appears somewhat uniform, with no clear peaks or patterns.
**Right Chart ("Thinking"):**
* The x-axis represents the "Reasoning Step," ranging from 0 to 14000.
* The importance scores (y-axis) fluctuate significantly over the reasoning steps.
* **Trend:** The importance scores are generally higher at the beginning and end of the reasoning process, with a dip in the middle.
* From 0 to approximately 4000, the scores are relatively high, with many bars reaching the upper range of the color gradient.
* From 4000 to approximately 12000, the scores are generally lower, with fewer bars reaching the upper range.
* From 12000 to 14000, the scores increase again, approaching the levels seen at the beginning.
* The red dotted line represents the "Mean Score: 0.347; Ratio: 0.226." This line appears to be positioned around the 0.347 level on the y-axis (Importance Score).
### Key Observations
* The "Thinking" chart shows a clear trend of higher importance scores at the beginning and end of the reasoning process, with a dip in the middle.
* The "Question" chart shows a more uniform distribution of importance scores.
* The mean score and ratio for the "Thinking" chart are indicated by a red dotted line, providing a reference point for the overall importance score.
### Interpretation
The data suggests that, during the "Thinking" process, the importance of each step varies significantly. The higher importance scores at the beginning and end might indicate that the initial setup and final conclusion steps are considered more critical than the intermediate steps. The dip in importance scores in the middle could represent a phase of routine processing or less critical analysis. The "Question" chart, with its more uniform distribution, might represent the initial importance assigned to different aspects of the question itself, before the reasoning process begins. The mean score and ratio provide a quantitative measure of the overall importance during the "Thinking" process.