\n
## Dual-Panel Bar Chart: Importance Score vs. Reasoning Step
### Overview
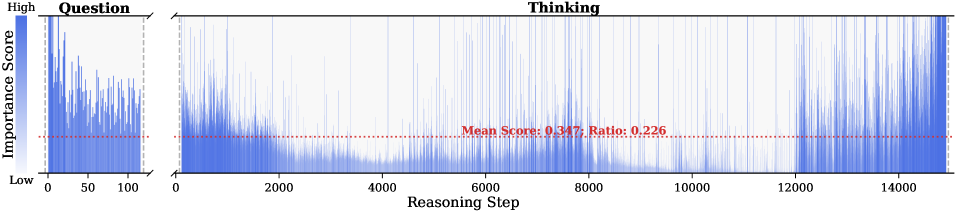
The image displays a two-panel horizontal bar chart (or heatmap-style visualization) comparing the "Importance Score" of elements across "Reasoning Steps" in two distinct contexts: "Question" and "Thinking." The chart uses a blue color gradient to represent score magnitude and includes a statistical reference line.
### Components/Axes
* **Y-Axis (Vertical):** Labeled **"Importance Score"**. The scale is qualitative, marked with **"High"** at the top and **"Low"** at the bottom. No numerical scale is provided.
* **X-Axis (Horizontal):** Labeled **"Reasoning Step"**. It is a numerical scale representing a sequence or timeline.
* **Panels:** The chart is split into two distinct panels:
1. **Left Panel:** Titled **"Question"**. Its x-axis ranges from **0 to 100**.
2. **Right Panel:** Titled **"Thinking"**. Its x-axis ranges from **0 to 14000**.
* **Data Representation:** Data is shown as vertical blue bars. The height (or intensity) of each bar corresponds to the Importance Score at that specific Reasoning Step. The color gradient appears to map from a lighter blue (lower score) to a darker, more saturated blue (higher score).
* **Reference Line:** A horizontal **red dashed line** runs across both panels at a constant y-position. In the "Thinking" panel, this line is annotated with the text: **"Mean Score: 0.347; Ratio: 0.226"**.
### Detailed Analysis
* **"Question" Panel (Steps 0-100):**
* The distribution of importance scores is highly variable and dense.
* There are numerous sharp peaks (high importance scores) scattered throughout the 100-step range, with no single dominant cluster.
* The red dashed line (mean score) sits in the lower half of the vertical scale, indicating that the majority of steps have an importance score below this mean value.
* **"Thinking" Panel (Steps 0-14000):**
* This panel shows a much longer sequence. The data pattern is characterized by long stretches of low importance scores (short, light blue bars) interspersed with frequent, sharp spikes of high importance (tall, dark blue bars).
* The spikes appear to be distributed somewhat randomly across the entire 14,000-step range, with no obvious periodic pattern.
* The annotated **Mean Score of 0.347** (on an implied 0-1 scale) confirms that the average importance is relatively low. The **Ratio of 0.226** likely indicates the proportion of steps that are considered "important" (perhaps those above the mean or a certain threshold).
* **Cross-Panel Comparison:** The "Question" phase is short (100 steps) and densely packed with variable importance. The "Thinking" phase is two orders of magnitude longer (14,000 steps) and shows a "sparse" pattern where high-importance events are rare but occur throughout the process.
### Key Observations
1. **Bimodal Importance:** Both panels suggest a process where most steps have low importance, but a critical minority of steps have very high importance.
2. **Scale Disparity:** The "Thinking" process is vastly longer than the "Question" process (140x in terms of step count).
3. **Persistent Mean:** The same mean score line (0.347) is applied to both panels, suggesting it is a global average across the entire dataset or a fixed threshold for comparison.
4. **No Clear Temporal Clustering:** In the "Thinking" panel, high-importance steps do not appear to cluster in specific phases (e.g., only at the beginning or end); they are distributed across the entire timeline.
### Interpretation
This visualization likely represents the output of an analytical model (e.g., from AI interpretability research) that scores the importance of individual reasoning steps in a language model's process. The "Question" panel may analyze the model's processing of an input query, while the "Thinking" panel analyzes its internal chain-of-thought or generation process.
The data suggests that meaningful "reasoning" is not a continuous, uniformly important process. Instead, it is characterized by long periods of low-importance computation punctuated by brief, critical moments of high importance. The low mean score (0.347) and ratio (0.226) quantify this sparsity, indicating that only about 22.6% of the steps contribute significantly above the average. This pattern is consistent across both the initial question analysis and the extended thinking phase, though the latter operates on a much larger scale. The chart effectively argues that identifying these sparse, high-importance "spikes" is key to understanding the model's reasoning efficiency and decision points.