## Diagram: Causal Diagram with Variables
### Overview
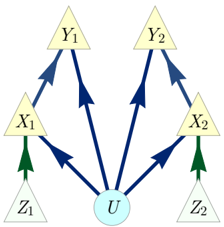
The image presents a causal diagram illustrating relationships between variables. The diagram consists of nodes representing variables and directed edges representing causal influences. The nodes are labeled with letters (X, Y, Z, U) and numerical subscripts.
### Components/Axes
* **Nodes:** Represented as triangles (for X, Y, Z) and a circle (for U).
* Nodes are labeled as follows:
* Z1 (bottom-left triangle)
* X1 (middle-left triangle)
* Y1 (top-left triangle)
* U (center circle)
* Z2 (bottom-right triangle)
* X2 (middle-right triangle)
* Y2 (top-right triangle)
* **Edges:** Represented as directed arrows, indicating the direction of causal influence.
* Arrows are colored in two shades: dark blue and dark green.
### Detailed Analysis
* **Node Z1:** Has a dark green arrow pointing towards X1.
* **Node X1:** Has a dark blue arrow pointing towards Y1 and a dark blue arrow pointing towards U.
* **Node Y1:** Has a dark blue arrow pointing towards it from X1.
* **Node U:** Has dark blue arrows pointing towards X1 and X2.
* **Node Z2:** Has a dark green arrow pointing towards X2.
* **Node X2:** Has a dark blue arrow pointing towards Y2 and a dark blue arrow pointing towards U.
* **Node Y2:** Has a dark blue arrow pointing towards it from X2.
### Key Observations
* The variable U influences both X1 and X2.
* Variables Z1 and Z2 directly influence X1 and X2, respectively.
* Variables X1 and X2 directly influence Y1 and Y2, respectively.
* The diagram suggests a structure where Z variables influence X variables, X variables influence Y variables, and U influences both X variables.
### Interpretation
The diagram represents a causal model where:
* Z1 and Z2 are potential causes or inputs to X1 and X2, respectively.
* X1 and X2 are intermediate variables that influence Y1 and Y2, respectively.
* U is a common cause or confounder that influences both X1 and X2.
The model could represent various scenarios, such as:
* Z1 and Z2 are treatments or interventions.
* X1 and X2 are mediators.
* Y1 and Y2 are outcomes.
* U is an unobserved variable that affects both X1 and X2.
The diagram highlights the potential for confounding bias due to the presence of U, which needs to be addressed in any causal inference analysis.