## Line Graphs: Performance Comparison with and without Reward Model (RM)
### Overview
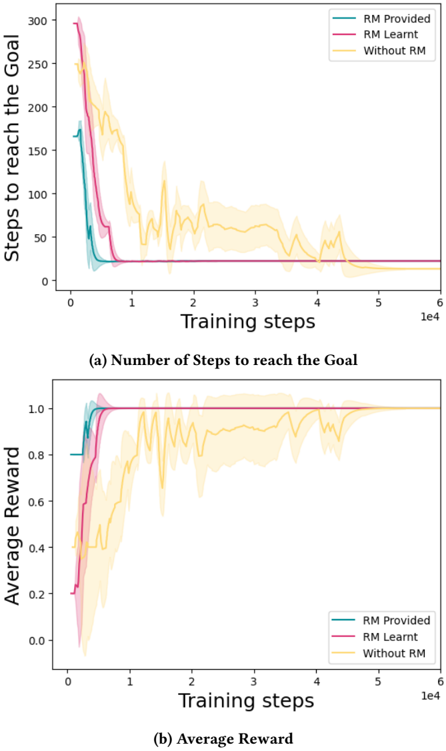
The image contains two line graphs comparing the performance of three training approaches: "RM Provided," "RM Learnt," and "Without RM." The graphs track metrics over training steps (x-axis: 0 to 10,000) and show how each method evolves in terms of efficiency (steps to goal) and effectiveness (average reward).
---
### Components/Axes
#### Graph (a): Number of Steps to Reach the Goal
- **X-axis**: Training steps (log scale, 0 to 10,000).
- **Y-axis**: Steps to reach the goal (linear scale, 0 to 300).
- **Legend**:
- Teal: "RM Provided"
- Pink: "RM Learnt"
- Yellow: "Without RM"
- **Shading**: Represents variability (confidence intervals or error margins).
#### Graph (b): Average Reward
- **X-axis**: Training steps (log scale, 0 to 10,000).
- **Y-axis**: Average reward (linear scale, 0.0 to 1.0).
- **Legend**: Same color coding as Graph (a).
---
### Detailed Analysis
#### Graph (a): Steps to Reach the Goal
1. **RM Provided (Teal)**:
- Starts at ~250 steps, drops sharply to ~50 steps by 1,000 training steps.
- Stabilizes near 0 steps by 10,000 steps.
- Shading indicates minimal variability after initial drop.
2. **RM Learnt (Pink)**:
- Begins at ~200 steps, declines to ~50 steps by 1,000 steps.
- Stabilizes near 0 steps by 10,000 steps.
- Slightly higher variability than "RM Provided" during early training.
3. **Without RM (Yellow)**:
- Starts at ~150 steps, fluctuates widely (peaks ~200 steps, troughs ~100 steps).
- Gradually declines to ~50 steps by 10,000 steps.
- Shading shows significant variability throughout training.
#### Graph (b): Average Reward
1. **RM Provided (Teal)**:
- Begins at ~0.2, rises sharply to ~0.9 by 1,000 steps.
- Stabilizes near 1.0 by 10,000 steps.
- Shading indicates tight confidence intervals after initial rise.
2. **RM Learnt (Pink)**:
- Starts at ~0.1, increases to ~0.8 by 1,000 steps.
- Reaches ~0.95 by 10,000 steps.
- Slightly more variability than "RM Provided" during early training.
3. **Without RM (Yellow)**:
- Begins at ~0.3, fluctuates between ~0.4 and ~0.7.
- Peaks at ~0.7 by 10,000 steps.
- Shading shows persistent variability, with no clear convergence.
---
### Key Observations
1. **Efficiency (Steps to Goal)**:
- Both RM methods ("Provided" and "Learnt") outperform "Without RM" significantly, achieving near-zero steps to goal by 10,000 steps.
- "Without RM" requires ~2–3× more steps to reach the goal compared to RM methods.
2. **Effectiveness (Average Reward)**:
- RM methods achieve ~90–100% reward by 10,000 steps, while "Without RM" plateaus at ~70%.
- "RM Provided" converges faster and more reliably than "RM Learnt."
3. **Variability**:
- "Without RM" exhibits the highest variability in both metrics, suggesting unstable learning.
- RM methods show tighter confidence intervals, indicating more consistent performance.
---
### Interpretation
The data demonstrates that integrating a Reward Model (RM), whether provided or learnt, drastically improves both efficiency and effectiveness in training.
- **RM Provided** acts as a strong baseline, enabling rapid convergence to optimal performance (near-zero steps and ~1.0 reward).
- **RM Learnt** performs comparably but requires slightly more training steps to stabilize, likely due to the additional complexity of learning the RM itself.
- **Without RM** struggles with both metrics, highlighting the critical role of RM in guiding exploration and reward optimization. The persistent variability in "Without RM" suggests that the agent lacks a structured reward signal, leading to suboptimal and inconsistent learning.
This analysis aligns with reinforcement learning principles, where reward shaping (via RM) accelerates convergence and stabilizes training dynamics.