## Chart: Performance Comparison of Verification Tools
### Overview
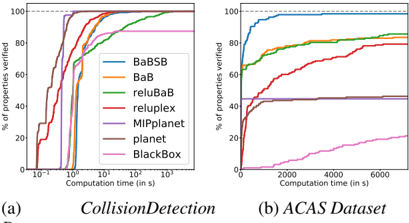
The image presents two charts comparing the performance of several verification tools (BaBSB, BaB, reluBaB, reluplex, MIPplanet, planet, and BlackBox) on two datasets: CollisionDetection and ACAS. The charts plot the percentage of properties verified against computation time. Both charts use a logarithmic scale for the x-axis (Computation time).
### Components/Axes
* **X-axis (Both Charts):** Computation time in seconds (logarithmic scale). The CollisionDetection chart's x-axis ranges from approximately 10<sup>-6</sup> to 10<sup>2</sup> seconds. The ACAS Dataset chart's x-axis ranges from 0 to 6000 seconds.
* **Y-axis (Both Charts):** Percentage of properties verified, ranging from 0% to 100%.
* **Legend (Top-Left of each chart):**
* BaBSB (Blue)
* BaB (Orange)
* reluBaB (Green)
* reluplex (Red)
* MIPplanet (Purple)
* planet (Brown)
* BlackBox (Pink)
* **Chart Titles:**
* (a) CollisionDetection
* (b) ACAS Dataset
### Detailed Analysis or Content Details
**Chart (a) - CollisionDetection:**
* **BaBSB (Blue):** Starts at approximately 0% at 10<sup>-6</sup> seconds, rapidly increases to approximately 80% by 10<sup>-2</sup> seconds, and plateaus around 90-100% from 10<sup>-1</sup> seconds onwards.
* **BaB (Orange):** Starts at approximately 0% at 10<sup>-6</sup> seconds, increases to approximately 70% by 10<sup>-2</sup> seconds, and plateaus around 90-100% from 10<sup>-1</sup> seconds onwards.
* **reluBaB (Green):** Starts at approximately 0% at 10<sup>-6</sup> seconds, increases more slowly than BaBSB and BaB, reaching approximately 60% at 10<sup>-1</sup> seconds, and plateaus around 80-90%.
* **reluplex (Red):** Starts at approximately 0% at 10<sup>-6</sup> seconds, increases slowly, reaching approximately 40% at 1 second, and plateaus around 60-70%.
* **MIPplanet (Purple):** Starts at approximately 0% at 10<sup>-6</sup> seconds, increases slowly, reaching approximately 30% at 1 second, and plateaus around 50-60%.
* **planet (Brown):** Starts at approximately 0% at 10<sup>-6</sup> seconds, increases slowly, reaching approximately 20% at 1 second, and plateaus around 40-50%.
* **BlackBox (Pink):** Starts at approximately 0% at 10<sup>-6</sup> seconds, increases very slowly, reaching approximately 10% at 1 second, and plateaus around 20-30%.
**Chart (b) - ACAS Dataset:**
* **BaBSB (Blue):** Starts at approximately 0% at 0 seconds, rapidly increases to approximately 80% by 2000 seconds, and reaches 100% by 4000 seconds.
* **BaB (Orange):** Starts at approximately 0% at 0 seconds, increases to approximately 60% by 2000 seconds, and reaches 80% by 4000 seconds.
* **reluBaB (Green):** Starts at approximately 0% at 0 seconds, increases to approximately 70% by 4000 seconds.
* **reluplex (Red):** Starts at approximately 0% at 0 seconds, increases slowly, reaching approximately 40% by 6000 seconds.
* **MIPplanet (Purple):** Starts at approximately 0% at 0 seconds, increases slowly, reaching approximately 20% by 6000 seconds.
* **planet (Brown):** Starts at approximately 0% at 0 seconds, increases slowly, reaching approximately 20% by 6000 seconds.
* **BlackBox (Pink):** Starts at approximately 0% at 0 seconds, increases very slowly, reaching approximately 10% by 6000 seconds.
### Key Observations
* **CollisionDetection:** BaBSB and BaB consistently outperform other methods, achieving high verification rates quickly. BlackBox performs the worst.
* **ACAS Dataset:** BaBSB again demonstrates the best performance, reaching 100% verification. The performance gap between the tools is less pronounced than in the CollisionDetection dataset, but BaBSB, BaB, and reluBaB still outperform the others.
* The logarithmic scale on the x-axis of the CollisionDetection chart highlights the rapid initial gains in verification percentage for the better-performing tools.
### Interpretation
These charts compare the effectiveness of different verification tools in proving properties of systems, specifically in the context of collision detection and ACAS (Airborne Collision Avoidance System) datasets. The percentage of properties verified represents the tool's ability to guarantee certain safety or correctness characteristics.
The consistent superior performance of BaBSB and BaB across both datasets suggests they are more efficient and scalable for these types of verification tasks. The slower performance of reluplex, MIPplanet, planet, and BlackBox indicates they may struggle with the complexity of these problems or require significantly more computation time to achieve comparable results.
The difference in performance between the datasets could be due to the inherent complexity of the properties being verified or the characteristics of the datasets themselves. The ACAS dataset appears to require more computation time overall to achieve high verification rates, potentially due to the more complex nature of the ACAS system.
The charts provide valuable insights for selecting the appropriate verification tool for a given application, highlighting the trade-offs between performance, scalability, and computational cost.