## Line Graphs: Algorithm Performance Comparison
### Overview
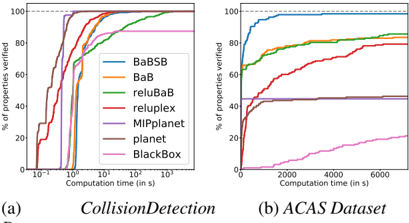
The image contains two line graphs comparing the performance of various algorithms in verifying properties over computation time. Graph (a) focuses on "CollisionDetection," while graph (b) analyzes the "ACAS Dataset." Both graphs plot computation time (x-axis) against the percentage of properties verified (y-axis).
### Components/Axes
- **Graph (a): CollisionDetection**
- **X-axis**: Computation time (logarithmic scale, 10⁻¹ to 10³ seconds).
- **Y-axis**: % of properties verified (0–100%).
- **Legend**:
- BaBSB (blue)
- BaB (orange)
- reluBaB (green)
- reluplex (red)
- MIPplanet (purple)
- planet (brown)
- BlackBox (pink)
- **Key Features**:
- Dotted horizontal line at 100% (y-axis).
- Lines start at the origin (0,0) and ascend to varying degrees.
- **Graph (b): ACAS Dataset**
- **X-axis**: Computation time (linear scale, 0 to 6000 seconds).
- **Y-axis**: % of properties verified (0–100%).
- **Legend**: Same algorithms as graph (a).
- **Key Features**:
- Dotted horizontal line at 100% (y-axis).
- Lines start at the origin (0,0) and ascend more gradually.
### Detailed Analysis
#### Graph (a): CollisionDetection
- **BaBSB (blue)**:
- Steepest ascent, reaching ~100% at ~10⁻¹ seconds.
- Dominates early computation times.
- **BaB (orange)**:
- Reaches ~100% at ~10⁰ seconds.
- Slightly slower than BaBSB but faster than others.
- **reluBaB (green)**:
- Reaches ~100% at ~10¹ seconds.
- Moderate performance.
- **reluplex (red)**:
- Reaches ~100% at ~10² seconds.
- Slower than reluBaB.
- **MIPplanet (purple)**:
- Reaches ~100% at ~10² seconds.
- Similar to reluplex but slightly delayed.
- **planet (brown)**:
- Reaches ~100% at ~10³ seconds.
- Significantly slower.
- **BlackBox (pink)**:
- Slowest ascent, reaching ~100% at ~10³ seconds.
#### Graph (b): ACAS Dataset
- **BaBSB (blue)**:
- Reaches ~100% at ~2000 seconds.
- Maintains lead over all algorithms.
- **BaB (orange)**:
- Reaches ~100% at ~3000 seconds.
- Second-fastest.
- **reluBaB (green)**:
- Reaches ~100% at ~4000 seconds.
- Third-fastest.
- **reluplex (red)**:
- Reaches ~100% at ~5000 seconds.
- Slower than reluBaB.
- **MIPplanet (purple)**:
- Reaches ~100% at ~5000 seconds.
- Similar to reluplex.
- **planet (brown)**:
- Reaches ~100% at ~6000 seconds.
- Near the end of the x-axis range.
- **BlackBox (pink)**:
- Reaches ~100% at ~6000 seconds.
- Matches planet in performance.
### Key Observations
1. **BaBSB** consistently outperforms all algorithms in both datasets, achieving near-100% verification in the shortest time.
2. **BlackBox** is the slowest algorithm in both graphs, lagging behind even "planet."
3. **Logarithmic vs. Linear Scales**:
- In graph (a), logarithmic scaling emphasizes rapid early performance differences (e.g., BaBSB vs. BaB).
- In graph (b), linear scaling highlights gradual performance gaps in longer computation times.
4. **Dataset Complexity**:
- ACAS Dataset (graph b) requires significantly more computation time than CollisionDetection (graph a) for equivalent verification.
### Interpretation
- **Algorithm Efficiency**: BaBSB’s dominance suggests it is optimized for rapid property verification, making it ideal for time-sensitive applications.
- **Trade-offs**: Algorithms like reluplex and MIPplanet balance speed and accuracy but lag behind BaBSB.
- **BlackBox’s Limitations**: Its poor performance across both datasets indicates potential inefficiencies in its design or implementation.
- **Dataset Impact**: The ACAS Dataset’s complexity (longer computation times) may reflect higher-dimensional or more intricate problem spaces compared to CollisionDetection.
### Spatial Grounding & Trend Verification
- **Legend Placement**: Center-right in both graphs, ensuring clear visibility.
- **Color Consistency**:
- BaBSB (blue) matches all instances in both graphs.
- BlackBox (pink) is consistently the lowest-performing line.
- **Trend Logic-Check**:
- In graph (a), logarithmic scaling compresses time differences, making BaBSB’s early lead visually stark.
- In graph (b), linear scaling reveals gradual divergence, emphasizing BaBSB’s sustained advantage.
### Conclusion
The graphs demonstrate that BaBSB is the most efficient algorithm for property verification, while BlackBox underperforms across both datasets. The choice of algorithm depends on the trade-off between speed and computational resources, with BaBSB being optimal for rapid verification tasks.