TECHNICAL ASSET FINGERPRINT
cf76ec502efc6e4511760d45
Click to view fullscreen
Press ESC or click to close
FOUND IN PAPERS
EXPERT: gemini-2.0-flash VERSION 1
RUNTIME: nugit/gemini/gemini-2.0-flash
INTEL_VERIFIED
## Chart: Performance Comparison of Different Models
### Overview
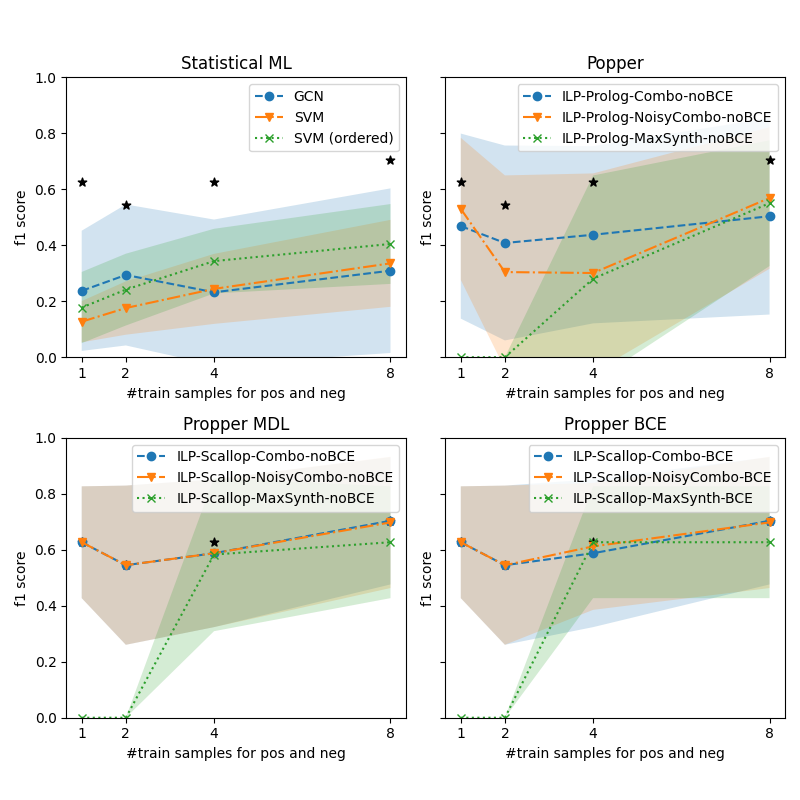
The image presents four line charts comparing the performance (f1 score) of different machine learning models across varying numbers of training samples. The charts are grouped into two rows, with the top row showing "Statistical ML" and "Popper" models, and the bottom row showing "Propper MDL" and "Propper BCE" models. Each chart plots the f1 score against the number of training samples for positive and negative examples. Shaded regions around the lines indicate uncertainty or variance. Black stars are overlaid on the charts, likely indicating statistical significance or best performance.
### Components/Axes
* **X-axis (all charts):** "#train samples for pos and neg" with tick marks at 1, 2, 4, and 8.
* **Y-axis (all charts):** "f1 score" ranging from 0.0 to 1.0, with tick marks at 0.2 intervals.
* **Titles (top-left):** "Statistical ML"
* **Titles (top-right):** "Popper"
* **Titles (bottom-left):** "Propper MDL"
* **Titles (bottom-right):** "Propper BCE"
**Legends:**
* **Top-left (Statistical ML):**
* Blue solid line with circles: "GCN"
* Orange dashed line with inverted triangles: "SVM"
* Green dotted line with crosses: "SVM (ordered)"
* **Top-right (Popper):**
* Blue solid line with circles: "ILP-Prolog-Combo-noBCE"
* Orange dashed line with inverted triangles: "ILP-Prolog-NoisyCombo-noBCE"
* Green dotted line with crosses: "ILP-Prolog-MaxSynth-noBCE"
* **Bottom-left (Propper MDL):**
* Blue solid line with circles: "ILP-Scallop-Combo-noBCE"
* Orange dashed line with inverted triangles: "ILP-Scallop-NoisyCombo-noBCE"
* Green dotted line with crosses: "ILP-Scallop-MaxSynth-noBCE"
* **Bottom-right (Propper BCE):**
* Blue solid line with circles: "ILP-Scallop-Combo-BCE"
* Orange dashed line with inverted triangles: "ILP-Scallop-NoisyCombo-BCE"
* Green dotted line with crosses: "ILP-Scallop-MaxSynth-BCE"
### Detailed Analysis
**Top-Left: Statistical ML**
* **GCN (Blue):** Starts at approximately 0.25 f1 score at 1 training sample, increases to approximately 0.35 at 8 training samples. The shaded region indicates a variance of approximately +/- 0.1.
* **SVM (Orange):** Starts at approximately 0.15 f1 score at 1 training sample, increases to approximately 0.35 at 8 training samples.
* **SVM (ordered) (Green):** Starts at approximately 0.2 f1 score at 1 training sample, increases to approximately 0.4 f1 score at 8 training samples. The shaded region indicates a variance of approximately +/- 0.1.
* Black stars are present at (1, 0.63), (2, 0.54), (4, 0.62), and (8, 0.70).
**Top-Right: Popper**
* **ILP-Prolog-Combo-noBCE (Blue):** Starts at approximately 0.55 f1 score at 1 training sample, decreases to approximately 0.4 f1 score at 2 training samples, and increases to approximately 0.6 f1 score at 8 training samples. The shaded region indicates a variance of approximately +/- 0.1.
* **ILP-Prolog-NoisyCombo-noBCE (Orange):** Starts at approximately 0.5 f1 score at 1 training sample, decreases to approximately 0.3 f1 score at 2 training samples, and increases to approximately 0.5 f1 score at 8 training samples. The shaded region indicates a variance of approximately +/- 0.1.
* **ILP-Prolog-MaxSynth-noBCE (Green):** Starts at approximately 0.1 f1 score at 1 training sample, increases to approximately 0.55 f1 score at 8 training samples. The shaded region indicates a variance of approximately +/- 0.2.
* Black stars are present at (1, 0.62), (2, 0.52), and (8, 0.72).
**Bottom-Left: Propper MDL**
* **ILP-Scallop-Combo-noBCE (Blue):** Starts at approximately 0.62 f1 score at 1 training sample, decreases to approximately 0.55 at 2 training samples, and remains relatively constant at approximately 0.6 f1 score at 8 training samples. The shaded region indicates a variance of approximately +/- 0.1.
* **ILP-Scallop-NoisyCombo-noBCE (Orange):** Starts at approximately 0.62 f1 score at 1 training sample, decreases to approximately 0.55 at 2 training samples, and remains relatively constant at approximately 0.6 f1 score at 8 training samples. The shaded region indicates a variance of approximately +/- 0.1.
* **ILP-Scallop-MaxSynth-noBCE (Green):** Starts at approximately 0.0 f1 score at 1 training sample, increases to approximately 0.65 f1 score at 8 training samples. The shaded region indicates a variance of approximately +/- 0.2.
* Black star is present at (4, 0.62).
**Bottom-Right: Propper BCE**
* **ILP-Scallop-Combo-BCE (Blue):** Starts at approximately 0.62 f1 score at 1 training sample, decreases to approximately 0.55 at 2 training samples, increases to approximately 0.7 f1 score at 4 training samples, and remains relatively constant at approximately 0.7 f1 score at 8 training samples. The shaded region indicates a variance of approximately +/- 0.1.
* **ILP-Scallop-NoisyCombo-BCE (Orange):** Starts at approximately 0.62 f1 score at 1 training sample, decreases to approximately 0.55 at 2 training samples, and increases to approximately 0.65 f1 score at 8 training samples. The shaded region indicates a variance of approximately +/- 0.1.
* **ILP-Scallop-MaxSynth-BCE (Green):** Starts at approximately 0.0 f1 score at 1 training sample, increases to approximately 0.7 f1 score at 8 training samples. The shaded region indicates a variance of approximately +/- 0.2.
### Key Observations
* The "Statistical ML" chart shows a general upward trend for all models as the number of training samples increases.
* The "Popper" chart shows an initial decrease in performance for "ILP-Prolog-Combo-noBCE" and "ILP-Prolog-NoisyCombo-noBCE" followed by an increase. "ILP-Prolog-MaxSynth-noBCE" shows a consistent upward trend.
* The "Propper MDL" chart shows that "ILP-Scallop-MaxSynth-noBCE" starts with a very low f1 score but increases significantly with more training samples. The other two models are relatively stable.
* The "Propper BCE" chart shows a similar trend to "Propper MDL" with "ILP-Scallop-MaxSynth-BCE" starting low and increasing significantly.
### Interpretation
The charts compare the performance of different machine learning models under varying training conditions. The f1 score, a measure of accuracy that considers both precision and recall, is used as the primary performance metric. The number of training samples for positive and negative examples is varied to assess how well each model learns from more data.
The shaded regions around the lines indicate the variability or uncertainty in the model's performance. Wider shaded regions suggest that the model's performance is more sensitive to variations in the training data.
The black stars likely indicate statistically significant performance improvements or the best-performing model at a given number of training samples.
The "Statistical ML" models generally improve with more training data, as expected. The "Popper" models show more complex behavior, with some models initially decreasing in performance before improving. The "Propper MDL" and "Propper BCE" charts highlight the importance of sufficient training data for certain models, particularly those using "MaxSynth."
The choice of model and training method (e.g., BCE vs. MDL) appears to significantly impact performance, and the optimal choice may depend on the amount of available training data.
DECODING INTELLIGENCE...