\n
## Line Chart: Predicting Final Outcome
### Overview
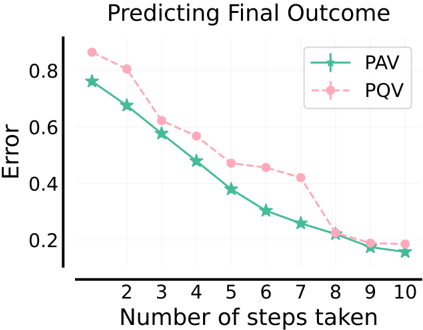
The image presents a line chart comparing the error rates of two methods, PAV and PQV, as the number of steps taken increases. The chart aims to demonstrate how the accuracy of predicting a final outcome improves with more steps.
### Components/Axes
* **Title:** "Predicting Final Outcome" (centered at the top)
* **X-axis:** "Number of steps taken" (ranging from 1 to 10, with tick marks at each integer value)
* **Y-axis:** "Error" (ranging from 0 to 1, with tick marks at 0.2 intervals)
* **Data Series 1:** PAV (represented by a teal line with star-shaped markers)
* **Data Series 2:** PQV (represented by a pink line with circular markers)
* **Legend:** Located in the top-right corner, labeling the two data series with their corresponding colors and symbols.
### Detailed Analysis
**PAV (Teal Line with Star Markers):**
The PAV line exhibits a generally downward trend, indicating a decrease in error as the number of steps increases.
* At 2 steps: Error ≈ 0.74
* At 3 steps: Error ≈ 0.65
* At 4 steps: Error ≈ 0.54
* At 5 steps: Error ≈ 0.42
* At 6 steps: Error ≈ 0.34
* At 7 steps: Error ≈ 0.28
* At 8 steps: Error ≈ 0.24
* At 9 steps: Error ≈ 0.21
* At 10 steps: Error ≈ 0.18
**PQV (Pink Line with Circular Markers):**
The PQV line also shows a decreasing trend, but it is less consistent than the PAV line.
* At 2 steps: Error ≈ 0.88
* At 3 steps: Error ≈ 0.78
* At 4 steps: Error ≈ 0.67
* At 5 steps: Error ≈ 0.58
* At 6 steps: Error ≈ 0.51
* At 7 steps: Error ≈ 0.45
* At 8 steps: Error ≈ 0.38
* At 9 steps: Error ≈ 0.27
* At 10 steps: Error ≈ 0.23
### Key Observations
* Both PAV and PQV methods demonstrate a reduction in error as the number of steps taken increases.
* PAV consistently exhibits lower error rates than PQV across all step values.
* The rate of error reduction appears to slow down as the number of steps increases for both methods.
* The PQV line shows a more pronounced decrease in error between steps 7 and 10 compared to PAV.
### Interpretation
The chart suggests that both PAV and PQV are effective methods for improving the accuracy of predicting a final outcome, with increasing accuracy as more steps are taken. However, PAV consistently outperforms PQV, indicating it is a more reliable method. The diminishing returns in error reduction with increasing steps suggest there may be a point where additional steps provide minimal improvement. The steeper decline in PQV's error rate at higher step counts could indicate that PQV benefits more from iterative refinement than PAV, or that it requires more steps to converge to a stable solution. The data implies that the choice of method (PAV vs. PQV) and the number of steps taken should be carefully considered based on the desired level of accuracy and computational cost.