## Chart: Loss vs. PFLOP/s-days
### Overview
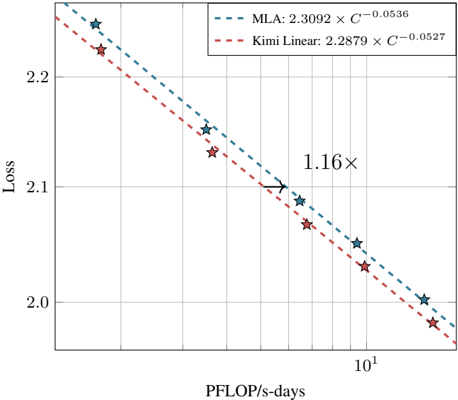
The image is a chart comparing the loss of two models, MLA and Kimi Linear, as a function of PFLOP/s-days. Both models exhibit a decreasing loss as PFLOP/s-days increases. The chart includes a legend, axis labels, and a visual indicator of the relative difference between the two models at a specific point.
### Components/Axes
* **X-axis:** PFLOP/s-days (logarithmic scale)
* Axis markers: 10^1 (10)
* **Y-axis:** Loss (linear scale)
* Axis markers: 2.0, 2.1, 2.2
* **Legend:** Located at the top of the chart.
* MLA: 2.3092 x C^-0.0536 (represented by a dashed blue line)
* Kimi Linear: 2.2879 x C^-0.0527 (represented by a dashed red line)
* **Data Points:** Represented by star markers.
* MLA: Blue stars
* Kimi Linear: Red stars
* **Annotation:** "1.16x" with an arrow pointing to a specific point on the chart.
### Detailed Analysis
* **MLA Data Series (dashed blue line, blue star markers):** The loss decreases as PFLOP/s-days increases.
* Approximate data points:
* At PFLOP/s-days ~ 2: Loss ~ 2.25
* At PFLOP/s-days ~ 5: Loss ~ 2.10
* At PFLOP/s-days ~ 10: Loss ~ 2.05
* At PFLOP/s-days ~ 20: Loss ~ 2.00
* **Kimi Linear Data Series (dashed red line, red star markers):** The loss decreases as PFLOP/s-days increases.
* Approximate data points:
* At PFLOP/s-days ~ 2: Loss ~ 2.23
* At PFLOP/s-days ~ 5: Loss ~ 2.08
* At PFLOP/s-days ~ 10: Loss ~ 2.03
* At PFLOP/s-days ~ 20: Loss ~ 1.97
* **Annotation:** The "1.16x" annotation with an arrow indicates that at a certain PFLOP/s-days value (approximately 5), the loss of the MLA model is 1.16 times higher than the loss of the Kimi Linear model.
### Key Observations
* Both MLA and Kimi Linear models show a decrease in loss as PFLOP/s-days increases.
* The Kimi Linear model generally has a lower loss than the MLA model across the range of PFLOP/s-days shown.
* The difference between the two models appears to decrease as PFLOP/s-days increases.
### Interpretation
The chart demonstrates the relationship between computational effort (PFLOP/s-days) and model loss for two different models, MLA and Kimi Linear. The decreasing loss with increasing PFLOP/s-days suggests that more computational resources lead to better model performance for both models. The Kimi Linear model consistently outperforms the MLA model, indicating that it is more efficient or better optimized for the given task. The "1.16x" annotation highlights the magnitude of the performance difference between the two models at a specific point. The logarithmic scale on the x-axis suggests that the initial gains in performance are more significant than later gains as PFLOP/s-days increases.